


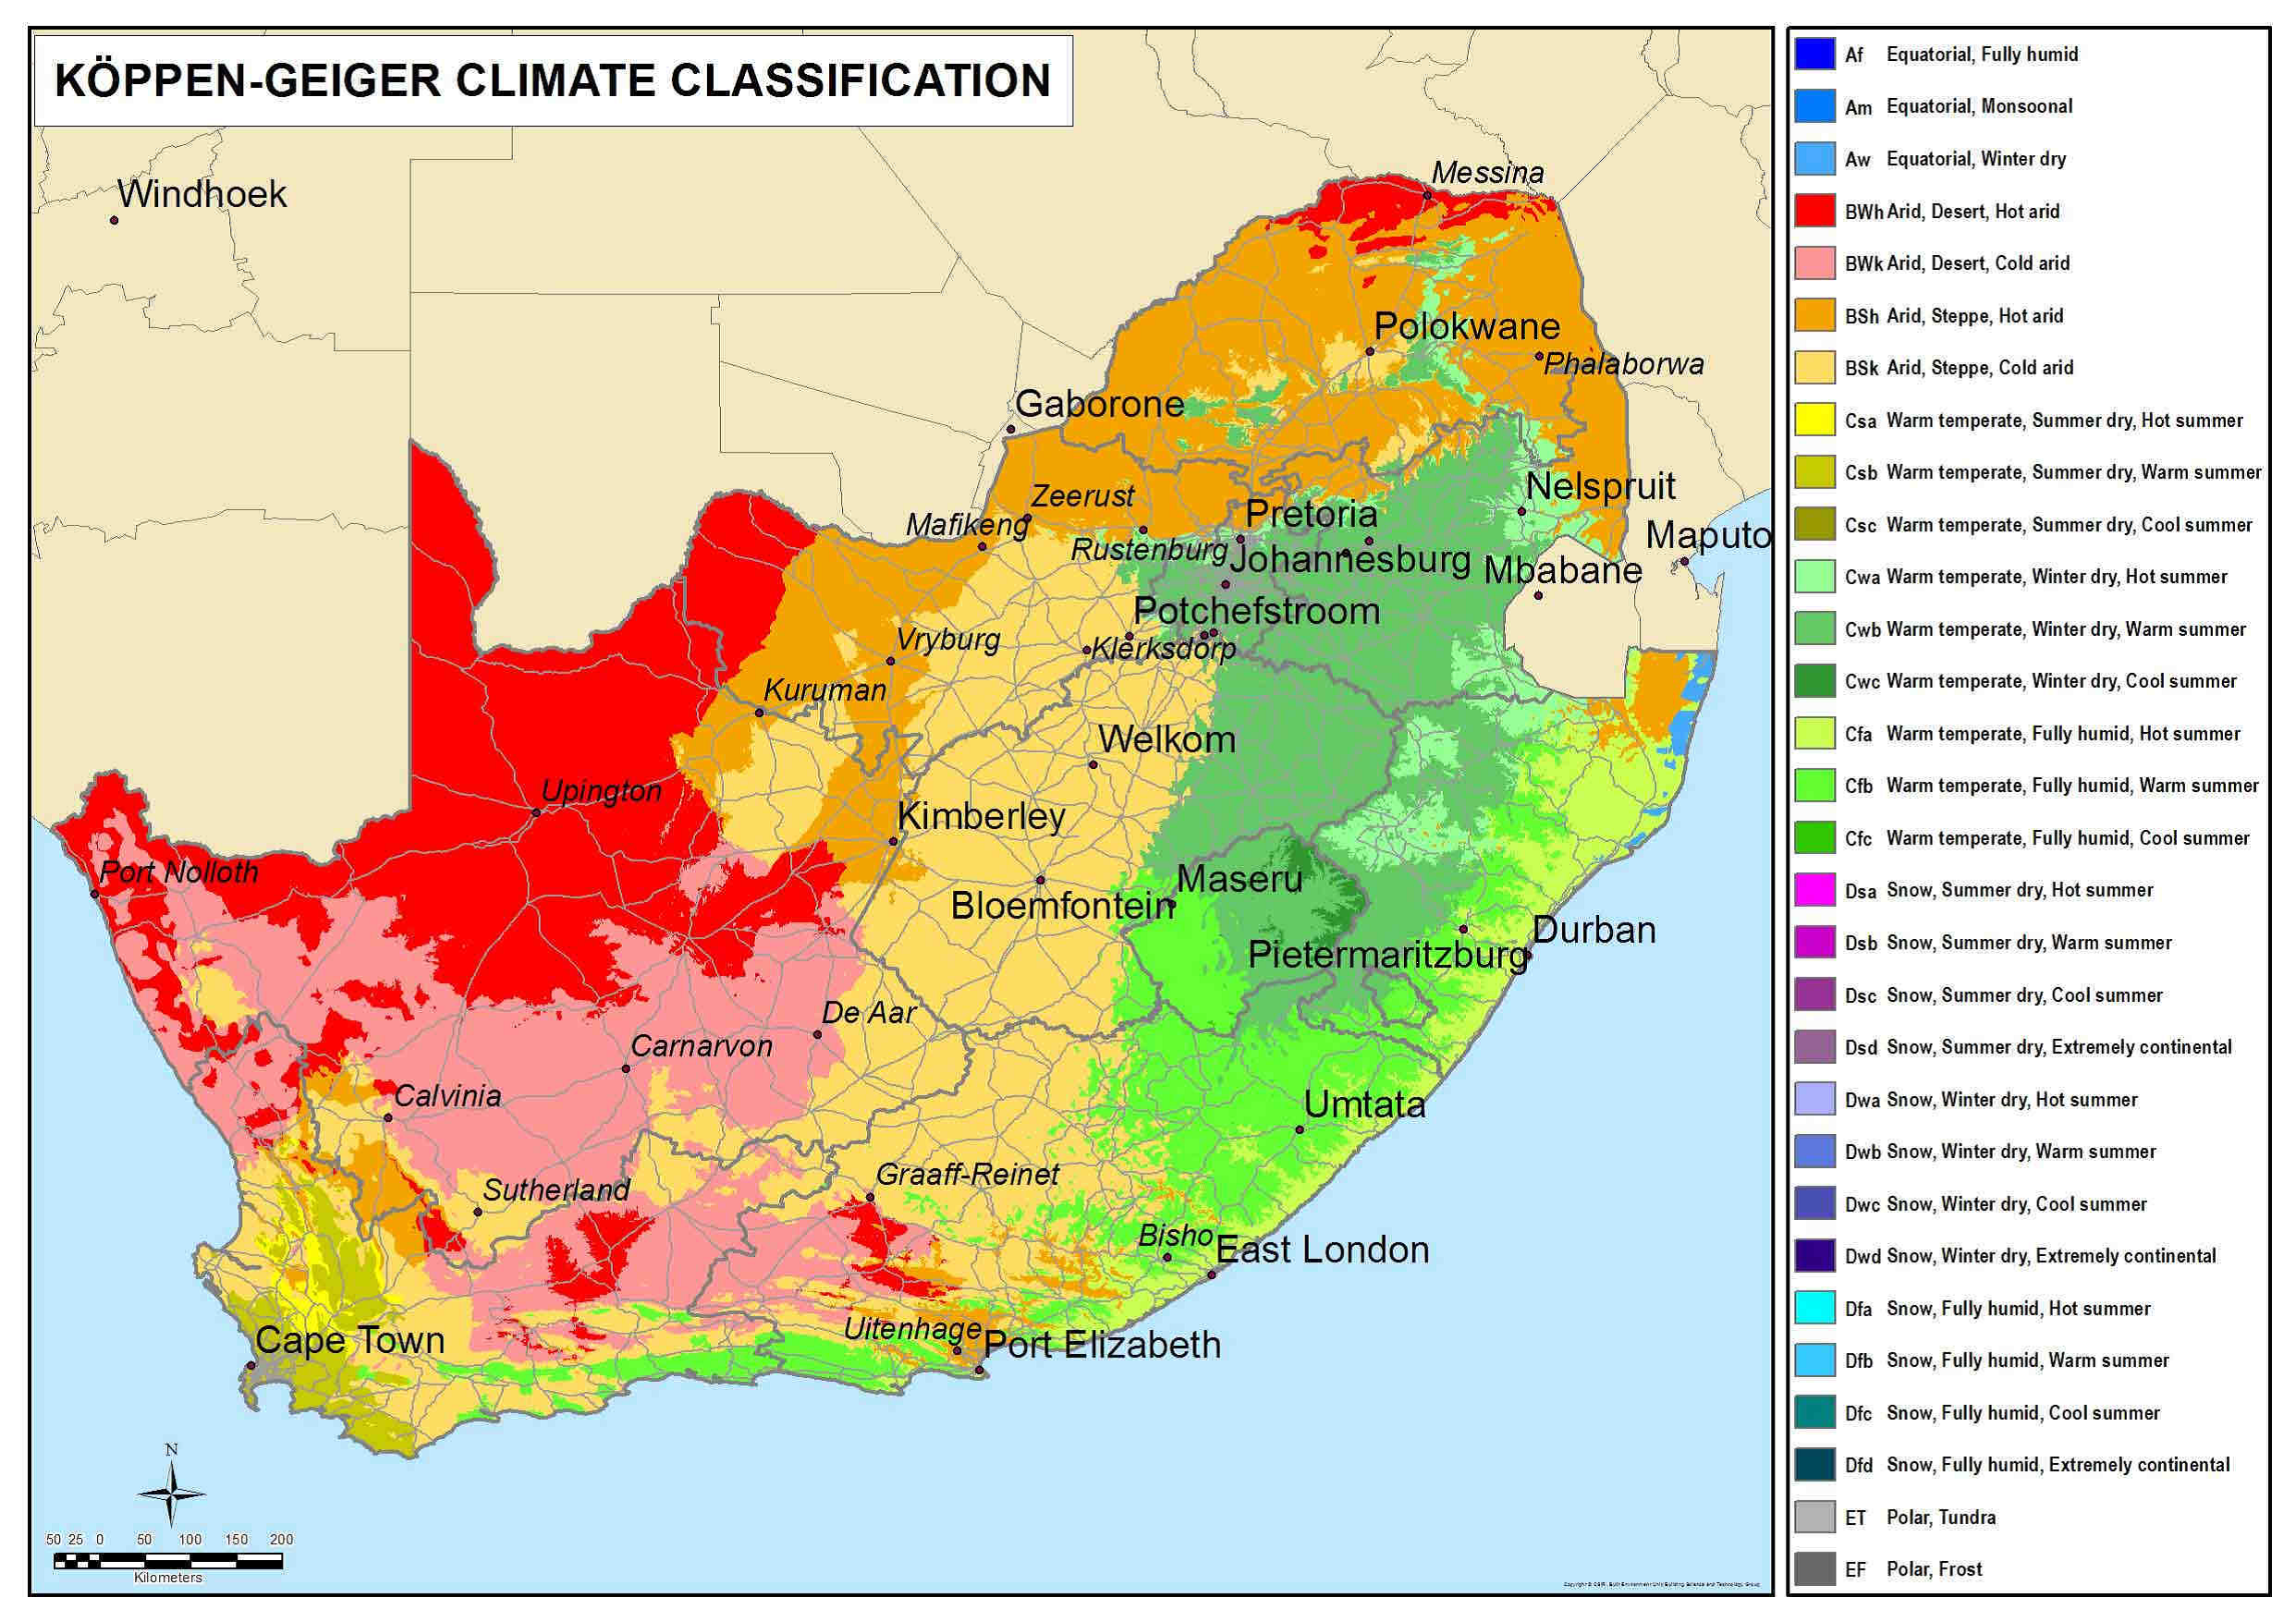
The challenge is set in various sectors - including the built environment sector - to respond to climate change, for example, by making use of passive building design strategies. The CSIR created a new Köppen-Geiger map to quantify the current South African climatic conditions using temperature and precipitation data from1985 to 2005. Algorithms described by Kottek (2006) were used to compile the map on a 1 km x 1 km grid. The Köppen-Geiger map is now available online on the StepSA website for free use as part of a series of climate indicator maps.
For an interactive view of the indicator click here
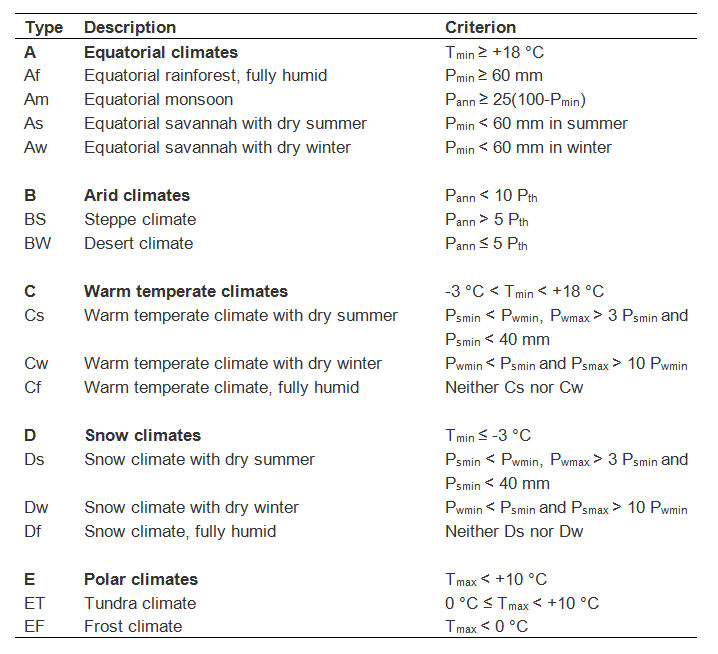
The Köppen-Geiger classifications consider five primary categories as follows:
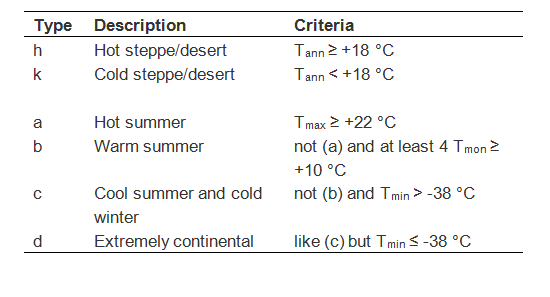
The classifications system further considers six secondary categories as follows:
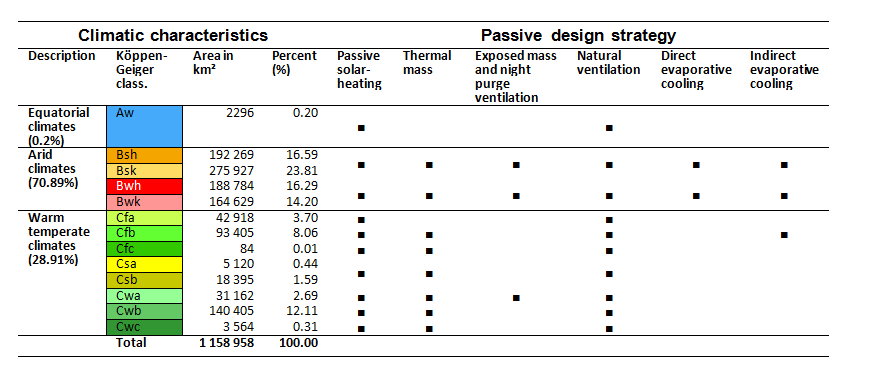
Thirteen distinct climate zones appear in South Africa when mapped according to Köppen-Geiger.
These climatic zones can be associated with a selection of passive design responses, which could be effectively deployed in those zones.
- CSIR Climate Map - Aridity
- CSIR Climate Map - Precipitation
- CSIR Climate Map - Heating degree day
- CSIR Climate Map - Cooling degree day
- CSIR Climate Map - Energy demand map
- Conradie, D.C.U. 2013. Appropriate Passive Design Approaches for the Various Climatic Regions in South Africa. In The Green Building Handbook, the Essential Guide, Vol. 5, 101-117.
- Conradie, D.C.U. 2012. Designing for South African Climate and Weather. In The Green Building Handbook, the Essential Guide, Vol. 4, 181-195.
The climate data can be downloaded free of charge and is stored in an ESRI File Geodatabase format (note the file is provided in a zip-file):
| Climate data | |
Web Map Services allow you to display maps on your computer without the need to download the data. You can use these web services with free software such as Google Earth and ArcGIS Explorer, and with many different GIS software packages.
For more information contact:
Tobias van Reenen,
TvReenen@csir.co.za