


Increasing pressure is being placed on various sectors - including the built environment sector - to respond to climate change and to reduce energy demand in the face of constrained supply.
The degree-days method has its origins in agricultural research where knowledge of the cumulative variation in outdoor air temperature is important. This concept is readily transferable to buildings and can be used in the analysis and assessment of weather related energy consumption in buildings. Degree-days are essentially a summation of the differences between the outdoor temperature and a base temperature over a specified time period. A key issue in the application of degree-days is the definition of this base temperature, which, in buildings, relates to the energy balance of the building and systems. This applies to both heating and cooling systems, which leads to the dual concepts of Cooling Degree Days and Heating Degree Days (CIBSE TM41, 2006).
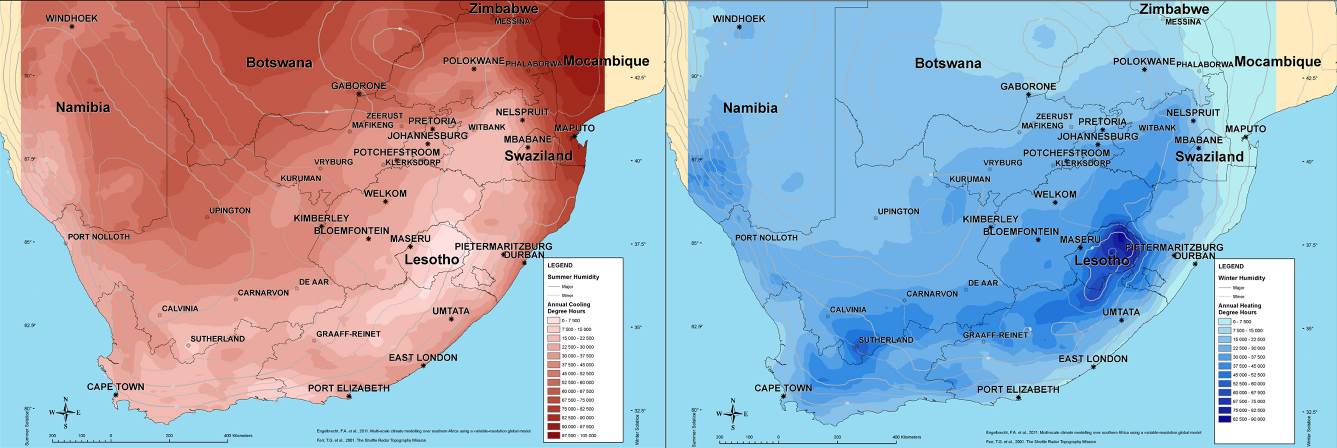
The heating degree day and cooling degree day map is now available online on the StepSA website for free use as part of a series of climate indicator maps.
International energy map precedents were studied. The most rigorous and precise method of calculating degree-days is to sum hourly temperature differences to the base temperature and divide these by 24 (CIBSE TM41, 2006). This method was adopted as it takes the often significant diurnal temperature variation in South Africa into account. Maps have been created using the current year, historic data over 10 years. This has been interpolated to obtain full coverage of South Africa and modelled 10 years into the future using the A2 climate change scenario. A lapse rate resampling procedure was used to take terrain into account.
For an interactive view of the heating degree day indicator click here
For an interactive view of the cooling degree day indicator click here
The Köppen-Geiger map is not best suited to support energy efficient building design directly, because human comfort in a particular climatic region is determined by the environmental factors of air temperature (dry bulb), radiant temperature, air speed and humidity(ASHRAE 55, 2004). The Köppen-Geiger functions are based on air temperature and precipitation. Furthermore it is also not suitable to estimate the anticipated amount of cooling and heating energy, because it is not taking account of the substantial diurnal variations in temperature normally experienced in South Africa.
Hourly data for relative humidity and dry-bulb temperature covering the 21 year period was converted to a raster dataset using ArcMap GIS. This raster dataset was then resampled to a 5 km grid taking terrain elevation into account. An average year was then calculated by taking the average for each hour of the year across the 21 years data. From this “average year” heating degree days and cooling degree days were calculated.
18 °C was set as the base temperature with defined breaks of approximately 300 Degree Days used for delineating the map classes. These classes were then simplified further into a single map called energy demand map distinguishing between Low, Medium and High (LMH) energy demand for both heating and cooling.
- CSIR Climate Map - Köppen-Geiger
- CSIR Climate Map - Aridity
- CSIR Climate Map - Precipitation
- CSIR Climate Map - Energy demand map
- Conradie, D.C.U. 2013. Appropriate Passive Design Approaches for the Various Climatic Regions in South Africa. In The Green Building Handbook, the Essential Guide, Vol. 5, 101-117.
- Conradie, D.C.U. 2012. Designing for South African Climate and Weather. In The Green Building Handbook, the Essential Guide, Vol. 4, 181-195.
- SANS 204-2. 2008. South African National Standard. Energy efficiency in buildings, part 2: The application of the energy efficiency requirements for buildings with natural environmental control. SABS Standards Division.
- SASBE paper
The climate data can be downloaded free of charge and is stored in an ESRI File Geodatabase format (note the file is provided in a zip-file):
| Climate data | |
Web Map Services allow you to display maps on your computer without the need to download the data. You can use these web services with free software such as Google Earth and ArcGIS Explorer, and with many different GIS software packages.
For more information contact:
Tobias van Reenen,
TvReenen@csir.co.za