

Household income is a measure often used by planners and economists. It consists of the combined incomes of all people sharing a particular household or place of residence. Low levels of household income or household poverty is an item often used to depict where households are that have a low standard of living and which are subsequently most in need of services and assistance (such as grants, subsidised transport, etc.). How has this changed across the country? This item provides a comparison between poor households in 1996 and 2011.
National poverty change per settlement type between 1996 and 2011
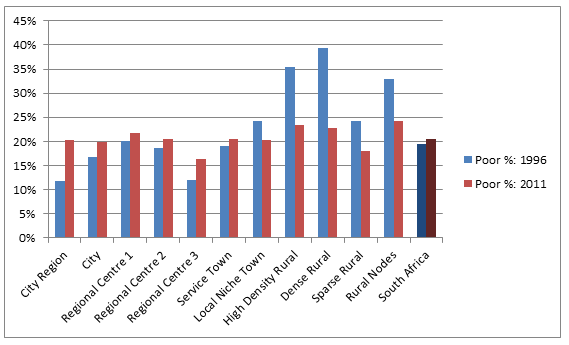
This provides an example of looking at the change of poor households within different settlement types (using the SACN/CSIR Typology). The ultimate aim is to target areas where poverty has increased as this often implies a need for services and infrastructure.
From a national perspective this information shows that poverty has increased slightly from 1996 to 2011, but that each settlement type has shown unique changes. All the rural settlement types across the country have seen a substantial decline in the proportion of households living in poverty. In dense rural settlements, poverty has declined the most. The overall decline of households living in poverty in rural areas can be accredited to the series of rural development interventions by Government since 1994. In 2001, rural node settlements had the highest proportion of households living in poverty even though it too had declined since 1996. City regions have shown the largest growth in the number of households living in poverty. This proportional growth is significant when considering the absolute number of households and people. With over 6 million households living in city region settlements in 2011, 1.2 million households were living in poverty. Read more >>
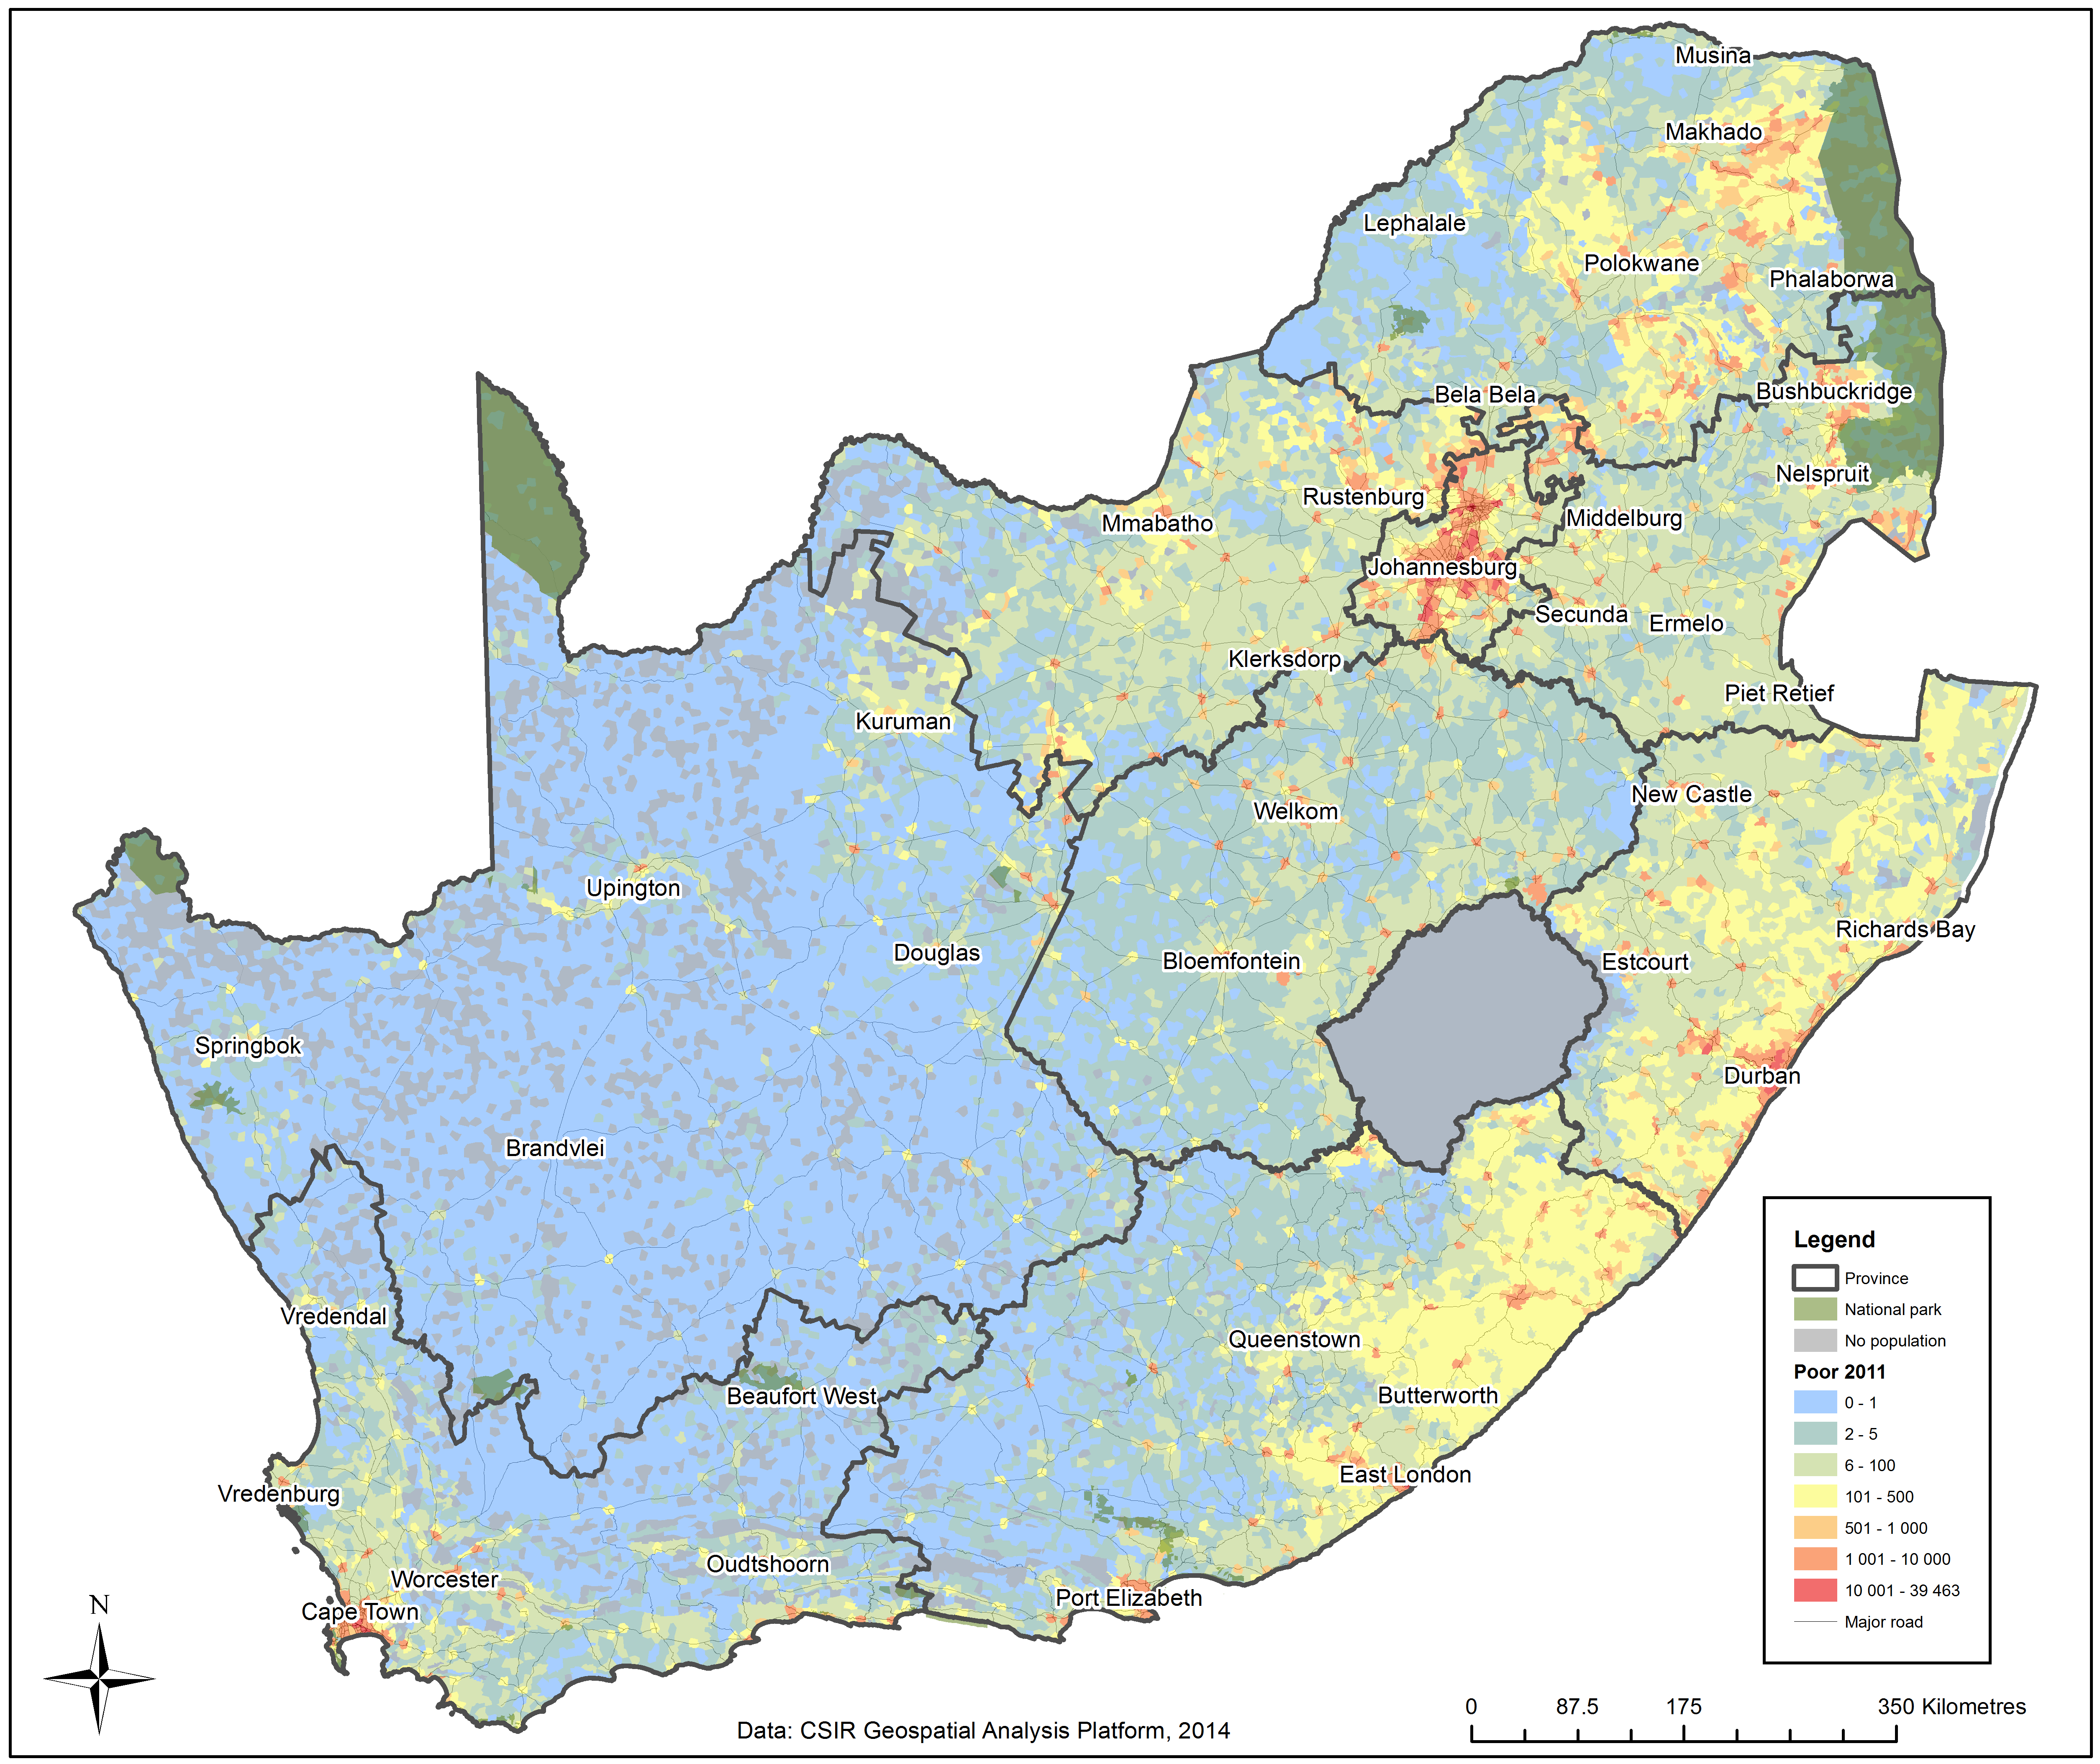
Map 1: Number of households living in poverty per mesozone in 2011
When viewing this information spatially (Map 2) it highlights the distribution of households living in poverty. Blue and green indicates less than 100 households living in poverty per mesozone, while yellow indicates between 101 and 500 households living in poverty per mesozone. Orange and red show areas with a very high concentration of households living in poverty, up to over 15 000 per mesozone. In Gauteng, Cape Town and Durban the increase in the number of households living in poverty can clearly be seen. Concentrations of poverty can also be seen in the northern parts of the country. The poverty densities are greatest in the urban areas; however, some rural areas to the north also show notable densities of households living in poverty. A significant extent of poverty can be seen along the eastern coast of KwaZulu-Natal and the Eastern Cape (2011). Read more >>
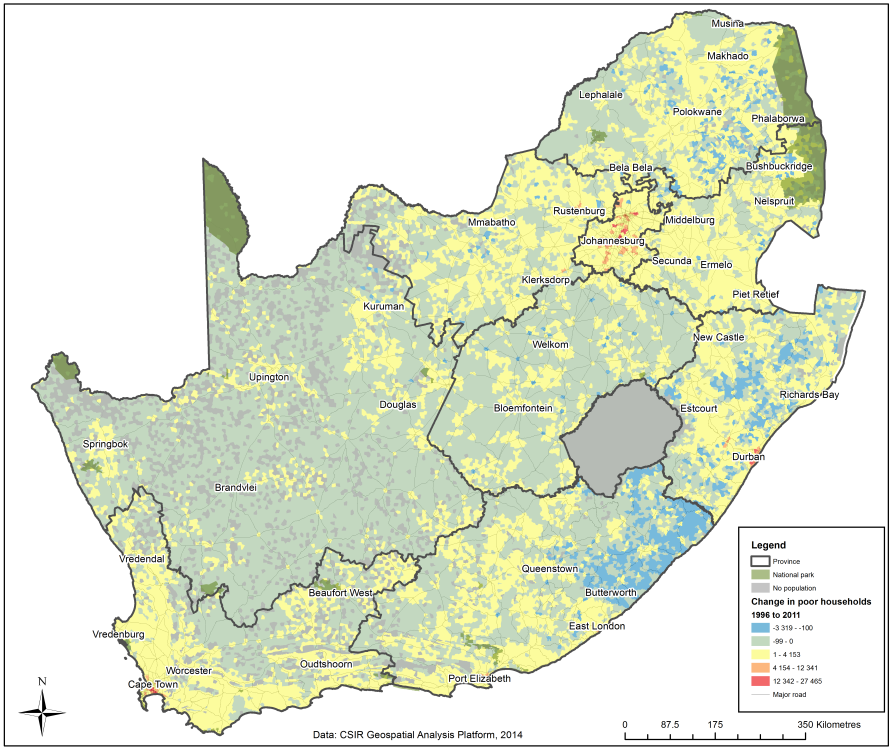
Map 2: Change in households living in poverty per mesozone 1996 to 2011
When considering changes in poverty over time it is noticeable (see map above) that households in poverty have decreased within the previous homeland areas whilst it has increased within metropolitan areas such as Gauteng, eThekwini and Cape Town. The urbanisation of poverty has often been blamed on rural poverty pushing people to migrate, but even as rural poverty has declined, urbanisation has continued and urban poverty has increased. Rural poverty has generally declined and the number of rural households living in poverty is far lower than urban households living in poverty.
In this instance household income is used as an indicator of the general economic welfare of South African citizens and how it has changed over the last 15 years. The household income data is used to calculate a poverty indicator. In a recently completed report on household income and expenditure patterns in South Africa for the year 2011 a classification on income levels per household was developed by the Bureau of Market Research at Unisa (2013).
Income levels and household classification defined by the BMR were:- • Poor (R0 - R54 344 income per annum)
- • Low emerging middle class (R54 345 - R151 727 income per annum)
- • Emerging middle class (R151 728 - R363 930 income per annum)
- • Realised middle class (R363 931 - R631 120 income per annum)
- • Upper middle class (R631 121 - R863 906 income per annum)
- • Emerging affluent (R863 907 - R1 329 844 income per annum)
- • Affluent (R1 329 845+ income per annum).
The definition of ‘poor’ cannot be directly extracted from the 2011 census income categories and these had to be adapted in order to calculate the total number of households within the Poor range. The 1996 census data’s first category is R0 to R24 000 per household per year. To calculate the relative 2011 income category for comparative purposes, the consumer price index from 1996 to 2011 was used to inflate R24 000 (1996) to establish the equivalent cut off of this group in 2011. After the number of households in the Poor category was established for the 1996 and 2011 census years, the proportional amount of Poor households to the total number of households per settlement type was calculated (Beukes, et al., 2014; Van Huyssteen, et al., 2014).
Reference:
- Beukes, A., Maritz, J., van Niekerk, W., Mans, G., van Huyssteen, E., & Green, C. (2014). A Comparative Analysis of City Regions. Unpublished PG research report. Pretoria: CSIR.
- Van Huyssteen, E., Mans, G., Maritz, J., van Niekerk, W., Le Roux, A., Green, C., et al. (2014). Regional and temporal dynamics of South African cities and towns. Unpublished PG research report. Pretoria: CSIR.
- Department of Rural Development & Land Reform – LUMT Tool
- State of the Cities Report
Core Team:
Gerbrand Mans, Johan Maritz, Dave McKelly, Alize le Roux, Mawande Ngidi, Elsona van Huyssteen, Cheri Green
For more information contact:
Gerbrand Mans,
gmans@csir.co.za