

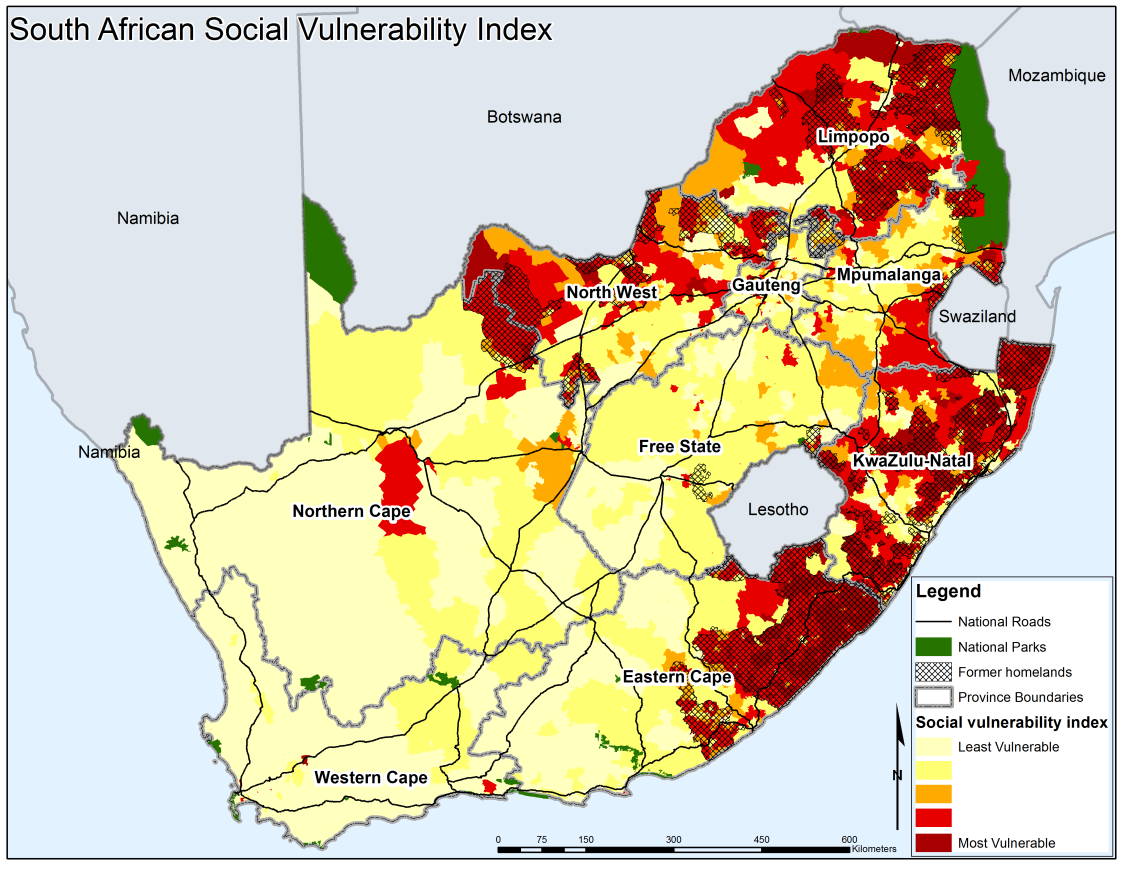
Social vulnerability in South Africa is a growing concern within well connected metros, cities and towns as well as isolated rural-hinterlands. Social vulnerability is defined as the inability of people, settlements and societies to cope with, withstand or adapt to the impact of multiple stressors such as disruptive natural or manmade events. Profiling the location of these communities allows planners and decision makers to effectively develop place-based emergency plans, streamlining risk governance and to prioritise intervention strategies in spatial integrated planning processes.Using 14 unique variables this index measures and identifies the location and level of social vulnerability across South Africa on Census 2011 ward level.
Profiling the social vulnerability of people and communities is the first step in starting to plan for resilient communities. The concept of social vulnerability is widely used and stems from multiple disciplines and has been used in multiple countries across multiple spatial scales. This uniquely developed South African index uses both national and international literature as the base and is currently used by the National Disaster Management Centre as part of their indicative Risk Profiles. Read more >>
The social vulnerability index is a composite indicator, created statistically through principal components analysis. The index makes use of verified, routinely available public data hence it can serve as a tool for tracking and monitoring change brought about by policy intervention investments. The index was derived from a Principal Component Analyses (PCA) on a ward level using the South African 2011 national census data. The PCA was based on 14 variables (household size average, age dependency ratio, percentage unemployed, percentage people below property line, percentage rural population, percentage shacks, percentage education, percentage disabled people, percentage female head of households, percentage population without electricity, percentage households without telephone lines, percentage people without a car, percentage people without public water, percentage immigrants) each representing an aspect of social vulnerability within a community as identified through national and international research. This multivariate statistical method uses interrelationships among large numbers of variables to extract common factors (components) which explain the underlying structure in the dataset. Essentially, these components explain the data in fewer dimensions than the original variables.
- Department of Science & Technology: SA Risk & Vulnerability Atlas
- Le Roux A, Makhanya S, Naude A.J.S. Creating a high resolution social vulnerability map in support of national decision makers in South Africa. ICC 2015 Cartography – Maps connecting the world. Springer book (forthcoming August 2015).
- Van Huyssteen, E., le Roux, A., Van Niekerk, W. 2013. Analysing risk and vulnerability of South African settlements: Attempts, explorations and reflections. Jàmbá, 5(2).
- Van Huyssteen E, Le Roux A. The South African socio-economic and settlement landscape. The South African Risk and Vulnerability Atlas – Mapping the way to a resilient future, 2010. pp 15-20.
Core Team:
Alize le Roux, Sibusisiwe Makhanya, Andreas J.S Naude (UP) (2013-2014)
Acknowledgement to original team as part of SA Risk and Vulnerability Atlas (SARVA) 2010-2013:
Alize le Roux, Elsona van Huyssteen & Willemien van Niekerk
For more information contact:
Alize le Roux,
alreoux1@csir.co.za