


Urbanisation has become a powerful force in the world and we now live in an era where more people live in towns and cities that ever before. The role of cities as drivers of economic growth has become increasingly important as the world becomes more urbanised. Cities are some of the most important sources of job creation and wealth generation. It is in cities that goods are produced and services are provided that reinforce economic opportunities on a much wider scale (SACN, 2012).
Cities in South Africa have also grown rapidly due not only to the obvious economic opportunities and employment prospects, but also as people view cities as potential places where livelihoods can be improved as people also seek better access to services. Cities therefore also carry an important role when it comes to social transformation – they are also centres of artistic, scientific and technological innovations, of culture and education. Due to its often rapid development, cities also carry development burdens – keeping pace with the high infrastructure demand and high number of the poor also moving into cities and arising social tensions. To assess the progress made by South African cities in the last 20 years in relation to development outcomes as well as to identify strategic problems and opportunities facing cities, the South African Cities Network is producing the latest State of the Cities Report. To support the analysis process a number of spatial indicators and or indices have being compiled by CSIR for the SACN during 2015, each illustrating a specific component of change or transformation.
To explore the extent of change three sets of indicators have been developed including:
- Three-dimensional spatial change – reflecting demographic and economic information
- Place based comparison of cities of performance and population dynamics
A new series of data sets has been developed depicting economic and demographic information using a single sized fine grained tessellation. There are several advantages to this approach; it provides less zone size distortion of information and generalisation. It also enables various forms of transects to be drawn. The most value has however been gained from depicting information using these small unit three-dimensionally. City values are depicted against a contextual map background.
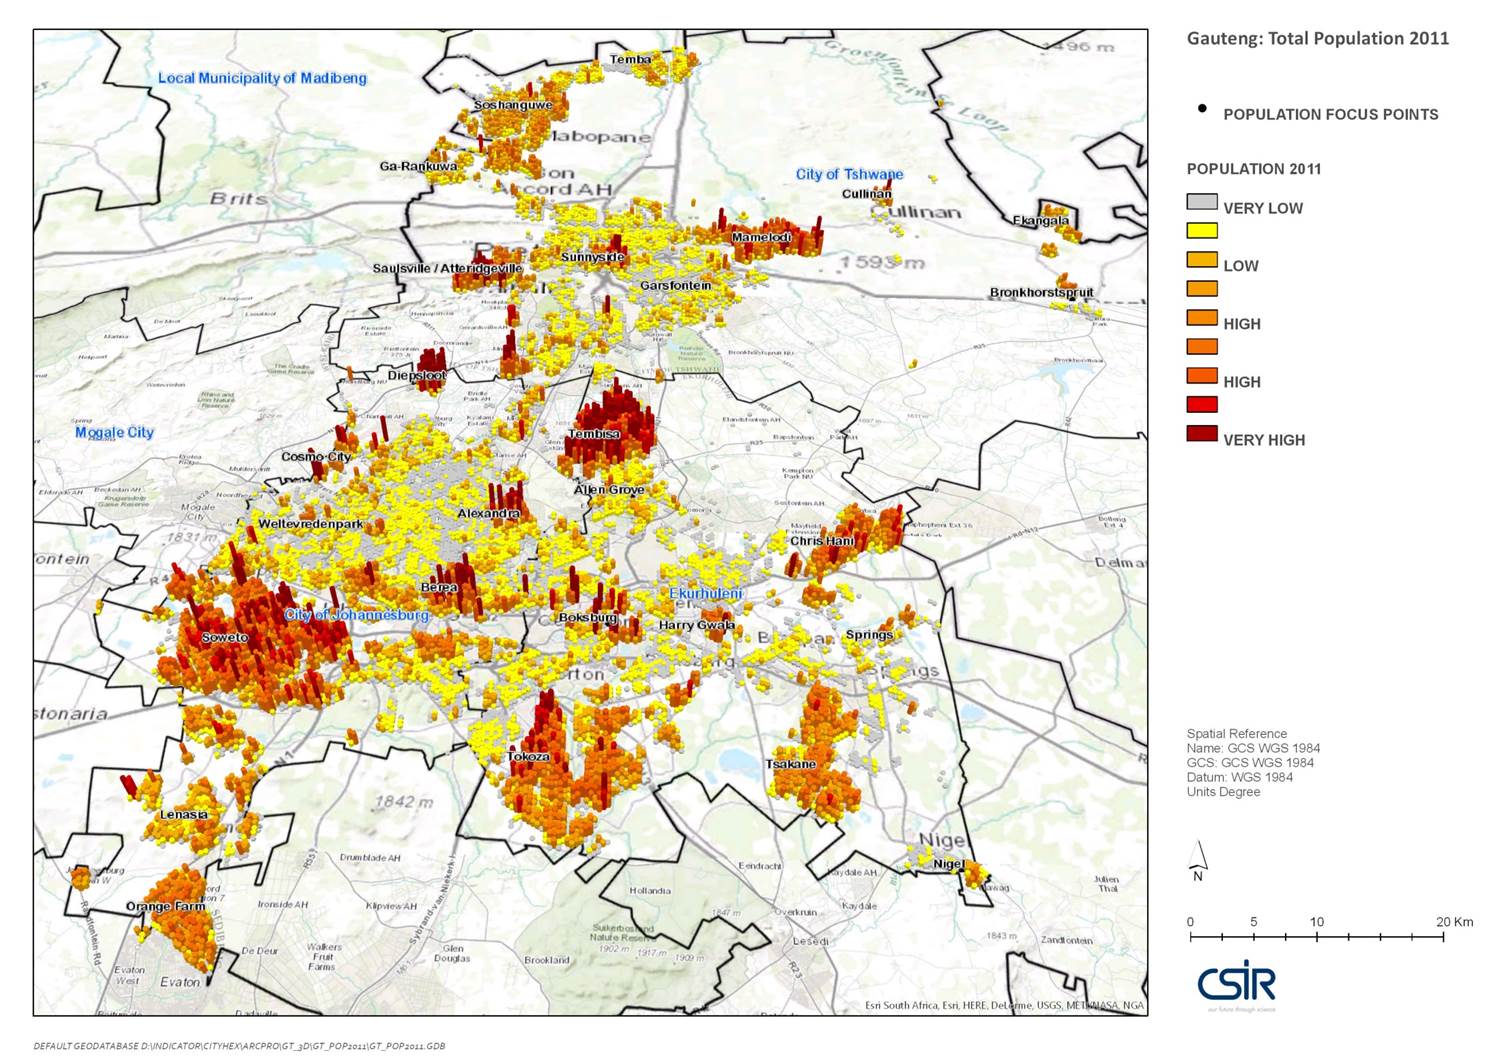
A hexagon tessellation (a hexagon being 15ha in size) was created for each metro. A CSIR developed algorithm was used to re-assign the population totals from the three census years (1996, 2001 and 2011) to the hexagon layer. The algorithm uses different secondary spatial datasets as input and is designed to disaggregate large area population data to smaller areas in such a way that it represents, or tries to represent, the original underlying statistical surface (see dasymetric mapping) as closely as possible.
Using equally sized units to portray the data allows for:
- better density comparisons across a city space; and
- negating the MAUP effect, which is a problem when using mapping units created for sampling purposes (like the census demarcations).
The location and size of the units being used (hexagons) are also consistent for all three time periods, which allows for easy identification of density variations (growth or decline) in specific areas / localities in a city over time.
These information layers has only been prepared for the largest cities in South Africa as listed below. For each the current demographic and economic extent is shown. Some cities also reflect the change over time (1996-2011). The cities featured are:
In the past using more detailed information for cities and settlements was often overlooked due to the expediency of using more summarised units such as Local Municipalities. This has made understanding or detecting change within such an area difficult. Viewing space through a finer place-based lens helps to detect patterns and trends not observed when looking more generally. Simply put, a place-based focus tries to differentiate between places across geographic space. The constraint often faced with current fine-grained spatial units, such as sub-place, main place, wards, voting districts and small areas, is that they do not as a whole remain constant. Because of changes over time information presented through such items cannot be directly compared. Similarly to the approach used in the section above, a dasymetric mapping /data partitioning process is required to enable comparison over time. It is also important to utilise existing information units such as sub-place due to the information available at this unit level. The following reflects a number of information items at sub-place level extracted from published statistics, and applied to present a number of variables. (Note items used are not exhaustive and will be added to). The items have been used to create several maps prepared as inputs to the 2016 State of the Cities Report. A number of items have also been placed into a sub-city spatial viewer that reflects information for South Africa’s nine biggest cities. The viewer enables multiple comparative views for a selected city. Two groups of data items are featured namely place-based and population dynamics.
The information is reflected individually for the nine cities and contains the following items:
PLACE BASED (sub place)
- Change in percentage households living in poverty for the period 1996-2011 reflected as numbers and as a percentage
- Change in percentage unemployment for the period 1996-2011
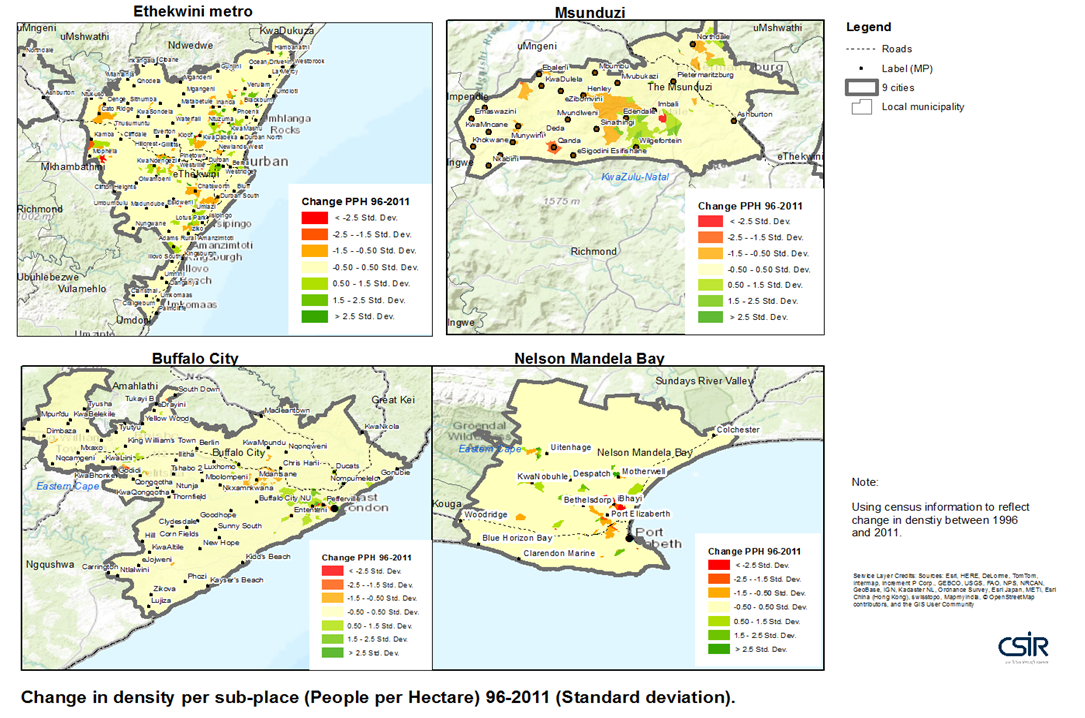
- Change in settlement density
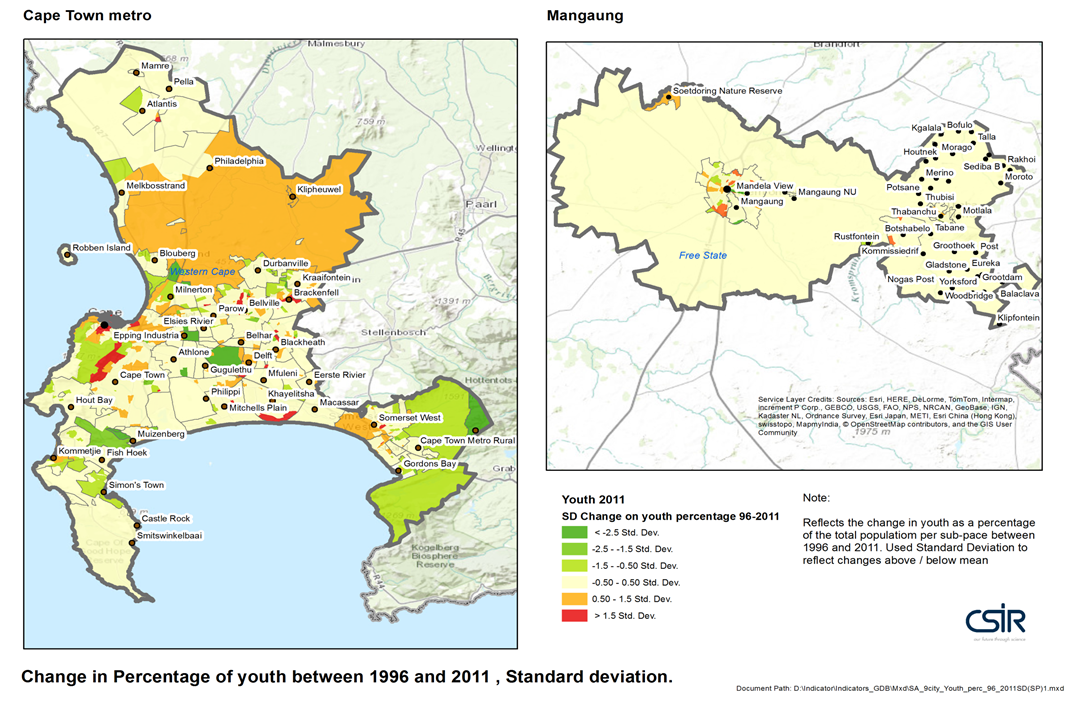
- Reflecting the youth as a percentage of the population for the period 1996-2011 also including the percentage youth for 2011
Some of the above indicators have been available through information provided by statistics South Africa. Some items are new and can be considered ‘indicators in development’. These items are being explored to support analysis to determine spatial change and transformation. For more information, feedback or for collaboration on these items please contact the StepSA team listed below.
- Energy poverty reflected by energy poor areas for period 2011 (also including areas where electricity is predominantly used)
- Racial diversity considering change since 1996 – 2011
Click on the links below for interactive views of the sub-city indicators (available for SA's 9 biggest cities):
POPULATION DYNAMICS (sub place)
Population trends and dynamics play an important role in development and are essential for planning. Population size, density and composition etc. changes and therefore impacts on provisions made for services (such as health care, education, housing etc.) as well as infrastructure provision (water, energy etc.). To respond to this dynamic it is essential to observe such change. Using the same approach as described above, sub-place level information is aligned for different time periods, enabling the user to detect trends. A number of demographic items have also been placed into a sub-city spatial viewer that reflects information for South Africa’s nine biggest cities. The information is reflected individually for the nine cities and contains the following items:
- Change in population per hectare 1996-2011
- Number of households in 1996, 2001, 2011
- Population change between 1996 and 2011
- Population in 1996, 2001, 2011
- Population per hectare 1006, 2011
- The percentage of the population with more than a matric qualification (for 2011)
These items can be accessed through a map viewer.
Core Team:
Johan Maritz, Elsona van Huyssteen, Alize le Roux, Gerbrand Mans, Amy Pieterse (2014-2015; CSIR)
Acknowledgement to contributors for updates & dissemination:
- SACN: State of Cities Report, 2015-2016 (Geci Karuri-Sebina)
- SACN & COGTA: Demographic Research Report to support the draft Integrated Development Framework, 2014 (Geci Karuri-Sebina)
For more information contact:
Johan Maritz, CSIR
jmaritz@csir.co.za
OR
Elsona van Huyssteen,
evhuyssteen@csir.co.za