

The need for interaction between the land use and transportation subsystems in Land Use and Transportation models arise from the fact that the spatial distribution of residential, business and industrial land uses in particular determines the location of human activities (such as living, working and shopping) such that trips have to be undertaken to overcome the distance between the locations of activities.
Conventionally this has been achieved through a loose coupling between UrbanSim and transportation models such as MATSim, EMME or VISUM. In the coupled system UrbanSim is responsible for providing indicators of demand (like where people live and work) to the transportation model which responds by providing indicators of supply (like peak-hour travel times) to UrbanSim, which could influence household location choices during the following simulation year. Ideally the interaction should take place every simulation year but since this significantly extends simulation time the interactions are usually restricted to occur every 5 years or when there is a change in the network.
Another drawback of the conventional approach is that most transportation models (excluding MATSim) work with origin-destination (OD) pairs at a spatial resolution of Transportation Analysis Zones, which are coarse compared to the parcel geography used by UrbanSim. This is known to have caused peculiar zonal artefacts such as job opportunities in neighbouring zones being easier to reach than opportunities within the zone itself. The rate at which the size of OD matrices grow (by the square of the number of zones) places a limit on increasing the spatial resolution by choosing smaller TAZs.
Due to the above constraints, researchers have investigated alternatives [Nicolai and Nagel 2011] based on the notion of high resolution accessibility. The objective of this work was to determine if measures of accessibility based on pairs of locations could be replaced by measures based on attributes of the location itself, because this would significantly reduce simulation times. The study was prompted by an observation that many of the variables used as determinants in UrbanSim’s Household Location Choice Model all over the world appeared to be accessibility measures anyway, for example jobs within 30 minutes’ drive time, distance to workplace, etc.
In the South African context, various studies have shown that about half of the population find themselves in the ‘low income’ category spending a disproportionate amount of their income on transportation. The CSIR consequently investigated replacing generalised costs with monetary costs in variables used as determinants of household behaviour. Generalized cost refers to the sum of the monetary and non-monetary costs of a trip. Non-monetary costs refer to the time spent undertaking the trip which can be converted to a monetary value by using a value of time, which varies according to the traveller's income and the purpose of the trip (adapted from Wikipedia).
This provides a more representative model of the majority of the South African population without sacrificing how the model deals with higher income groups. To put this in context it must be pointed out that our implementation of UrbanSim deals with five income groups in different sub models of the Household Location Choice Model, allowing completely different variables to be used as predictors of behaviour for each income group. Only one variable, namely the generalised cost is not available as a result of not having access to travel times. It should also be pointed out that it is no trivial matter to agree on the value of time and that even when travel times were available, they were rarely found to be more significant predictors of behaviour than distance-based variables. This has also been the finding from at least one of the case studies of the Sustain City project [Renner, Schirmer and Müller 2013], in which distance to workplace was found to be the second most important variable with ‘car accessibility’ (generalised cost) only the fifth most important.
Another difficulty with the value of time is the difference between stated and revealed preferences of households. If one asked households belonging to the high income group it is likely that they would put a high value on time. Yet these same households may be found living in estates which are not centrally located and that would add to their daily travel time, indicating that they do not value time. The answer may simply be that there are other factors which are even more important, such as the aspirational value or safety and security considerations, which are often quoted as a reason for the popularity of various types of estates.

The monetary cost of a trip is calculated using an adapted version of OpenTripPlanner (OTP) Analyst. OTP was originally developed for planning trips between a single origin and destination. OTP Analyst later used the same transit system model and optimization logic to enable searches between multiple origins and destinations in large batches. The CSIR then adapted OTP Analyst to compute the route with lowest monetary cost instead of the fastest route and used this as the basis for computing high resolution accessibility indicators. The routing algorithms consider all available modes of transport including limited distance walking and cycling, private vehicles, minibus taxis and mass transit, with unlimited transfers between any of the modes. The road network is obtained from OpenStreetMap but very few operators in South Africa publish mass transit routes, stops and fares in the required GTFS (General Transit Feed Specification) format so this takes some effort.
Note that since the alternative approach does not depend on the congested state of the networks, there is no need for the costly coupling between UrbanSim and transportation models, at least not for the purpose simulating urban growth. If the scenarios to be simulated include indicators based on (congested) travel times or if the purpose of the simulation is determine traffic volumes, one would have run a transportation model like MATSim, EMME or VISUM, but this could be restricted to the start and end years of the simulation.
A sample of the results obtained from applying the above to Nelson Mandela Bay Metro is shown below as the number of jobs that can be reached from any origin in the city for under R40 per day. The R40 threshold represents about 25% of the median monthly household income of all South Africans. Note that the transit network used is by no means complete, consisting of a Metrorail line (for which GTFS could be obtained) and a few BRT routes (for which GTFS had to be constructed). This limited network was nevertheless sufficient as a demonstration.
The mode described as ‘drive-alone’ represents a trip by single occupancy vehicle with no part of the trip undertaken by transit. This is considered to be the mode of choice of high income households. The mode described as ‘transit’ represents a trip by rail if available, otherwise by BRT if available or failing that by minibus taxi. This is considered to be the mode of choice for the ‘low income’ group of households. Since unlimited transfers are allowed a single trip could consist of any combination of available modes (except single occupancy vehicle).
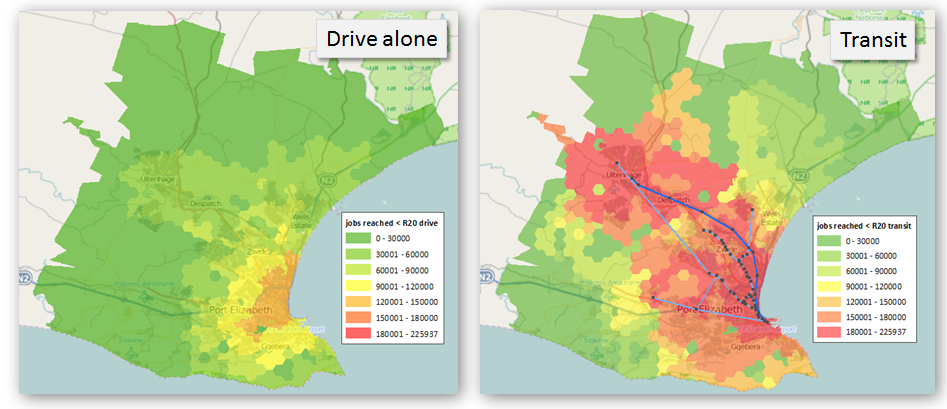
The two maps confirm a dramatic increase in the number of jobs that can potentially be accessed by transit for under R40 per day. For the drive-alone mode there are no zones that can even access the 150 000 jobs category (59% of the 253 803 non-home-based jobs in 2001) but for the transit mode, a large number of zones are able to access the top category of 180 000 jobs (71%) and the most accessible zone is able to access 89% of all the non-home-based jobs available in the city for under R40 per day!
For more information contact:
Quinton van Heerden, CSIR
qvheerden@csir.co.za