

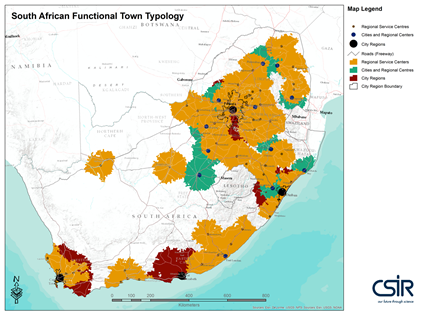
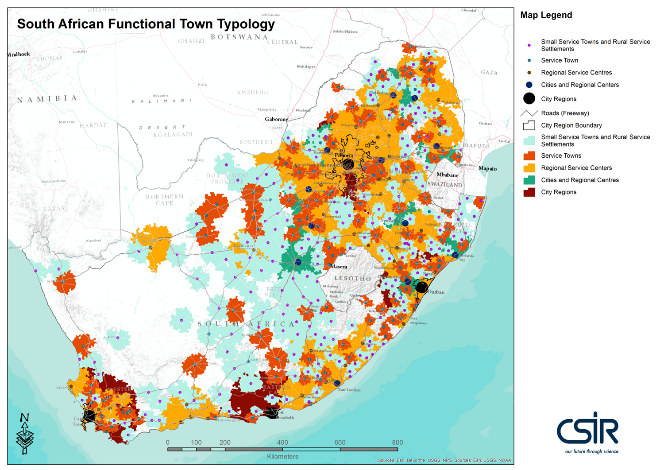
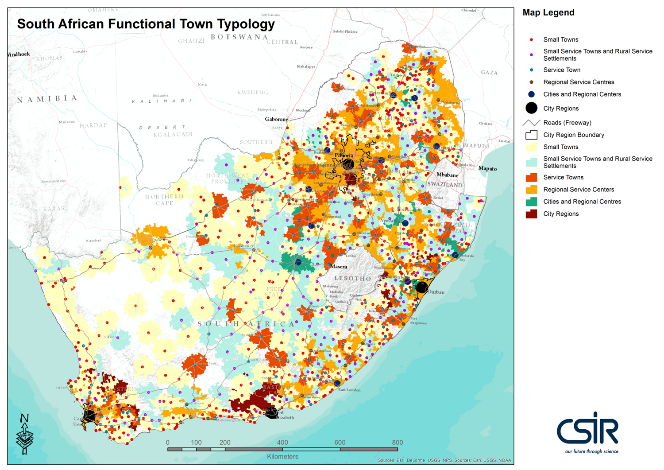
The Functional Settlement Typology was originally developed by the CSIR as part of the National Spatial Trends Overview project (2008-2009) commissioned by the South African Cities Network, The Presidency and former DPLG to inform Cabinet discussions on urban development policy aspects and the process of developing a National Urban Development Framework (SACN et al, 2009). It was developed through an interactive technical and consultative process, overseen by an expert reference group. The typology development was widely consulted, presented and utilised within development planning, and government policy and planning units (Van Huyssteen et al, 2009 & Spocter et al, 2010).
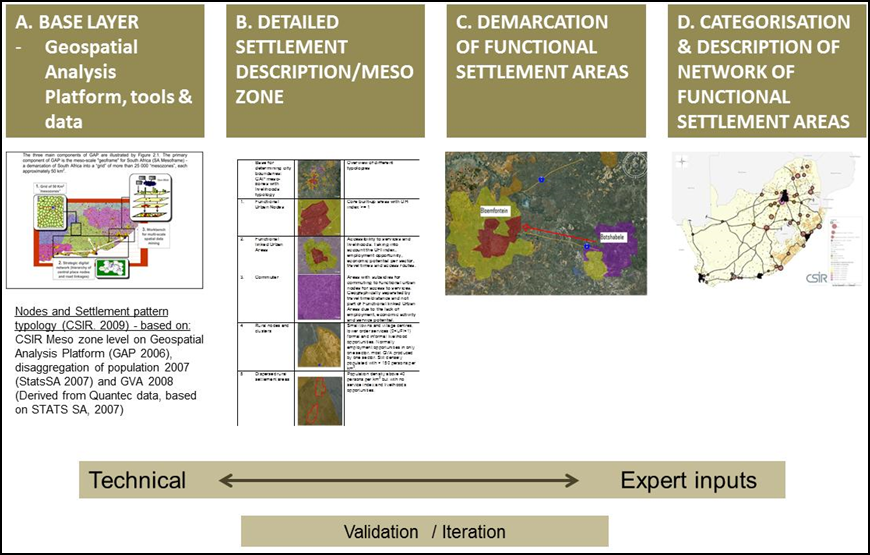
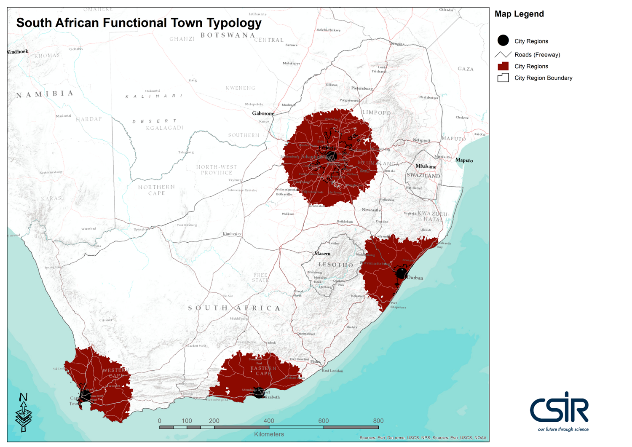
Figure 1 provides an indication of the core building blocks utilised to develop the original 2008/2009 typology.
The National Planning Commission has since its inception made use of some of the spatial analysis, as well as spatial planning and policy inputs developed over the last couple of years in support of national policy and planning processes, provincial planning processes, as well as municipal (especially district and metropolitan) planning processes. After a number of discussions on the possible nature of a spatial narrative, and the development of framework for such a narrative, that could support the NPC work, the CSIR was requested to provide support to strategic spatial analysis and planning support to the NPC in terms of inter alia refining typologies and profiling of settlements and sparsely populated areas.
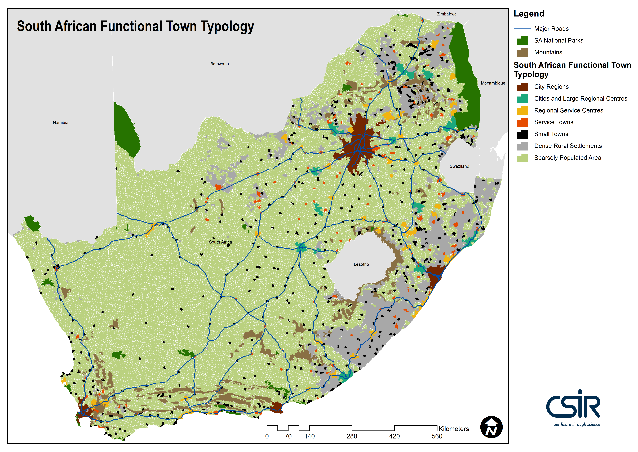
The basic methodology followed, was to focus on providing some profiling and enhanced understanding of settlement and land-use patterns to inform the Spatial Diagnostic and Spatial Narrative. Given the request, the basic value that could be added within limited scope and budget, making use of most recent investment by the CSIR during 2010-2011 in terms of updating the mesoframe (basis of former typologies), updated disaggregation methodologies (utilised for disaggregation of data for the platform), as well as recent updates in data, have been that of revisiting existing typologies in order to support the identification, description and understanding of:
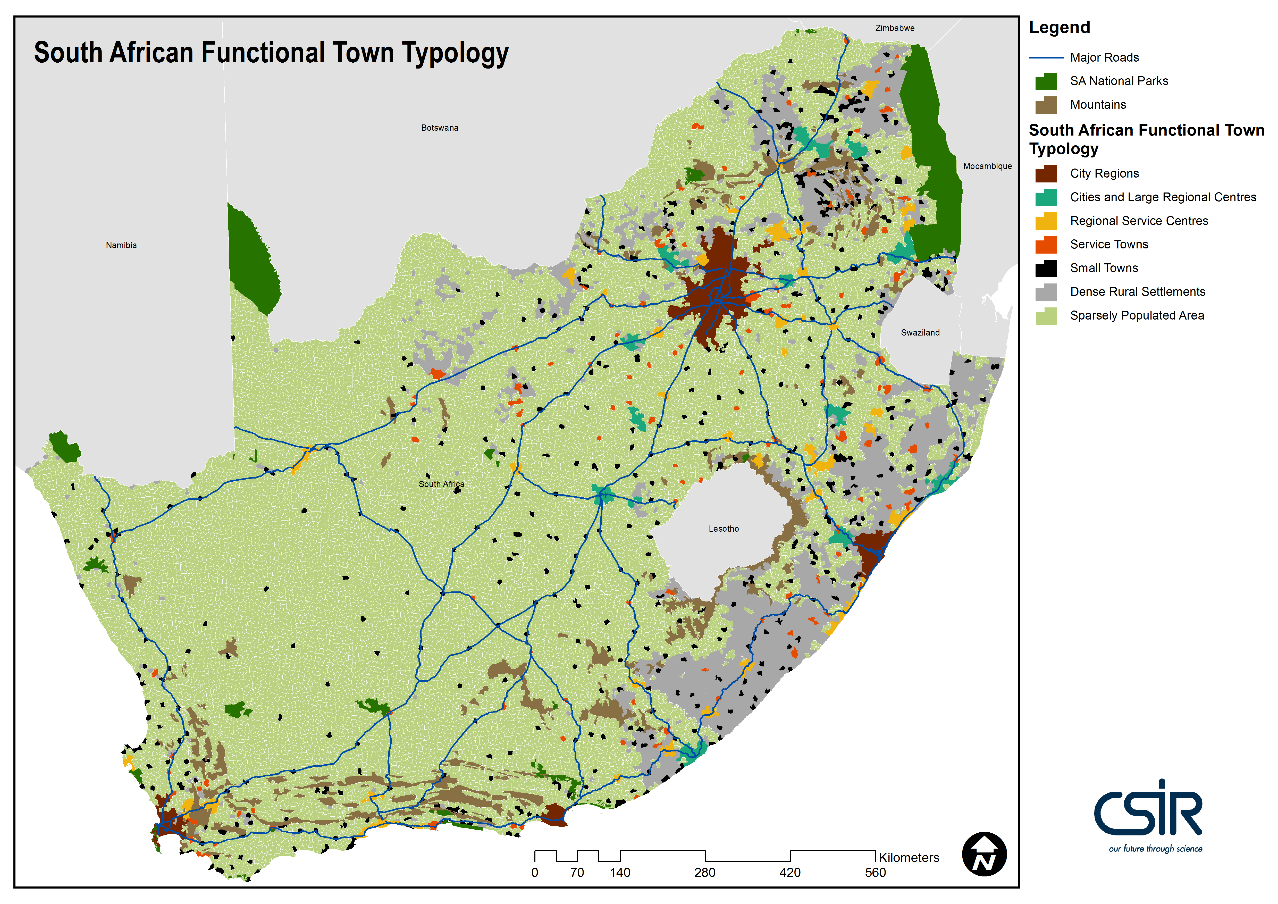
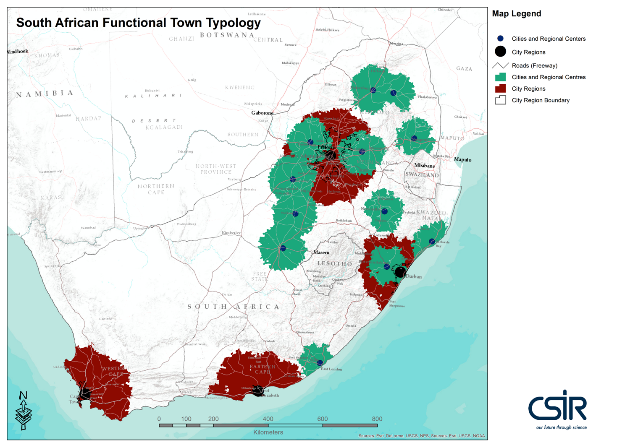
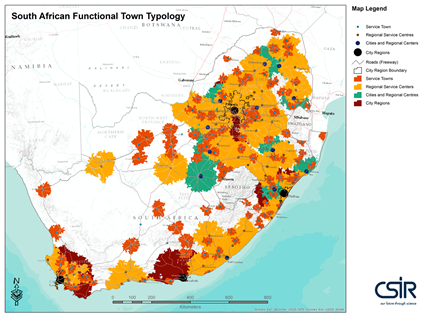
Below are the results of the updated settlement and land-use description at a mesozone demarcation:
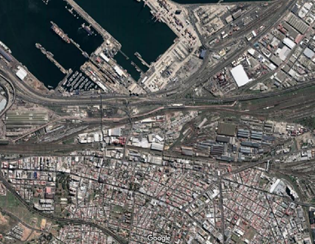
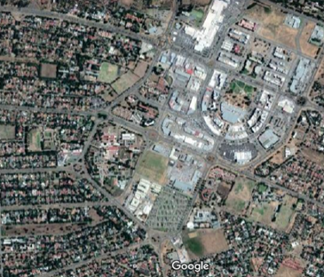
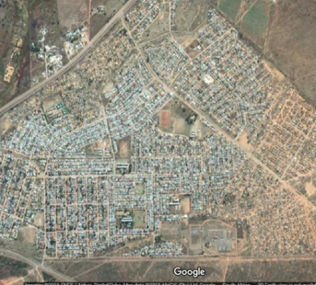
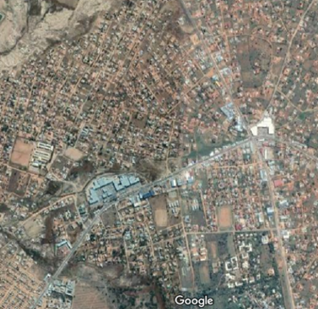
| CSIR Town Area Typology | Description of Functional Town Area Types / Sub-types Based on urban function in surrounding region and urban area size | Example of Morphology | Regional Location and conceptual illustration of regional service roles and reach |
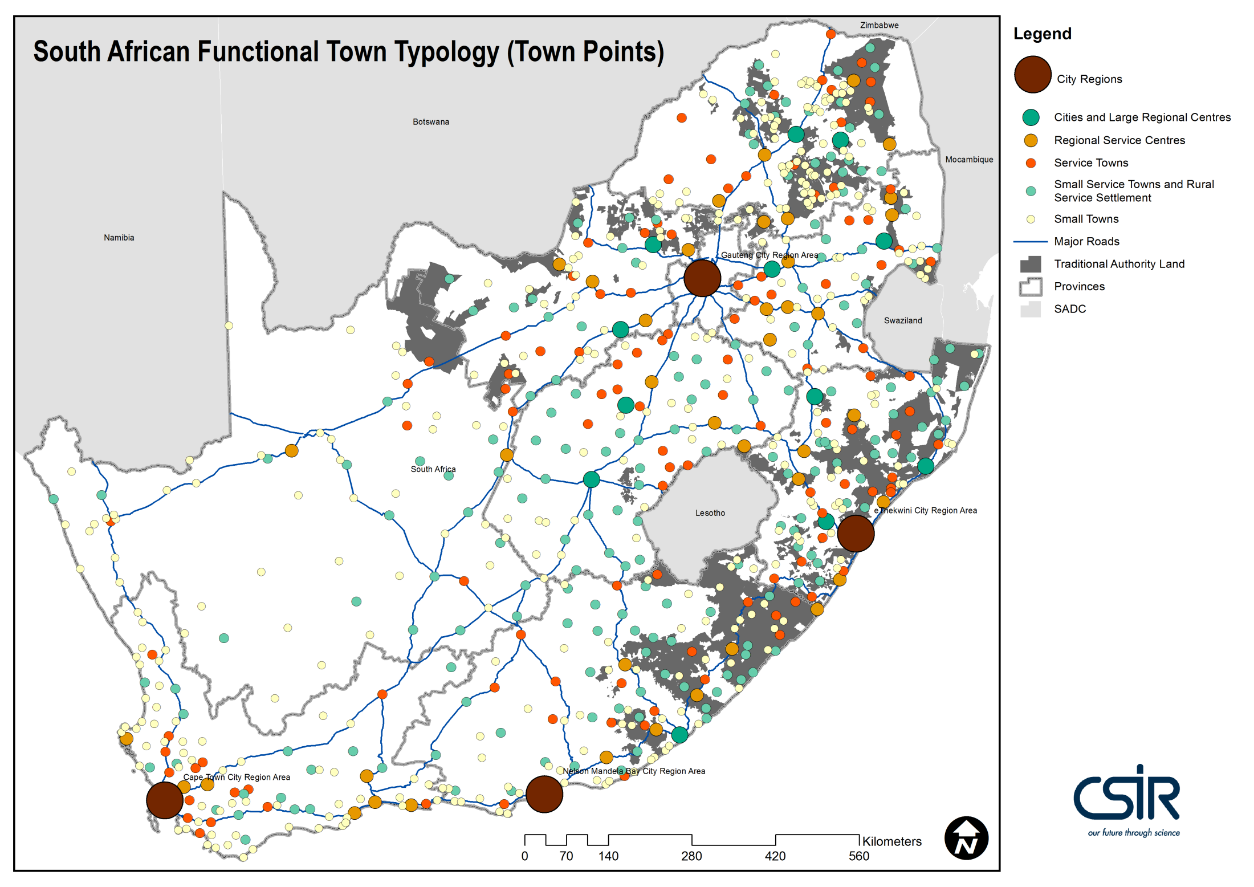
| City Regions | Population:> 1 million people Morphology: Large urban conurbations (functional regions) Economy: Diverse, Economic output > R40 816 mill/yr (2013) Places: Cape Town City Region, Gauteng City Region, eThekwini City Region, Nelson Mandela Bay City Region |
 |
 |
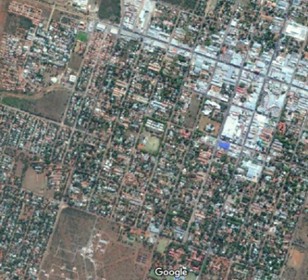
| Cities and Very Large Regional Centers | Population: > 500 000 people (cities), >300 000 (Very large towns) Morphology: Dense urban areas with interconnected settlements in functional hinterland areas Economy: Service related. Economic output >R7 900mill/yr (2013) (Cities); and >R4 000mill/yr (2013) City Examples: Buffalo City, Polokwane, Mangaung Very large regional centers: Welkom, Tzaneen, Witbank, New Castle |
 |
 |
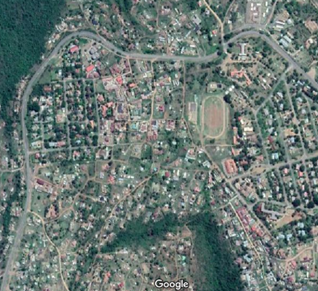
| Large Regional Centres | Population: 100 000-300 000 people Morphology: Regional node consisting of interconnected settlements, with significant reach in hinterland. Significant social and economic service role in region. Economy: Total economic output above R 1400mill in 2013 Examples: Mokopane, George, Mthatha, Ladysmith |
 |
 |
| Regional Centres | Population: < 100 000 people Morphology: Regional node consisting of interconnected settlements, with significant reach in hinterland. Significant social and economic service role in sparsely populated region. Economy: >Total economic output above R 1100mill in 2013 Examples: Bela-Bela , Bethlehem, Grahamstown, Mossel Bay |
 |
 |
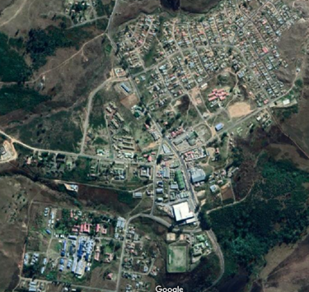
| Service Towns | Population: Population variation between 15 000 to 100 000 population Economy and Services: Providing an economic and social service anchor role in hinterland. Total economic output >R270mill (2013) in (Average Service related economic output R670mill/town) Examples: Jane Furse, Harrismith, Jeffreys Bay, Thabazimbi, Taung |
 |
 |
| Small Service Towns | Population: Less than 20 000 people in town itself. Morphology: Monocentric small towns, often apartheid landscape double centre towns Local Service role: Playing an anchor role as social service point, serving a large number of people within 30km from the town in denser areas and within 50km from the town in sparser area. Economy: Government and community services significant in local economy. Examples: Nkandla, Piketberg, Victoria West, Swartruggens |
 |
 |
| Rural Service Settlement |
Population:Varied in nodal settlement, large population in direct hinterland Morphology: Emerging nodes of consolidation in Dense Rural Settlements Local Service role: Strategically located to play an anchor role as social service point, serving a large number of people within 30km from the town in denser areas and within 50km from the town in sparser areas. Examples: Jozini, Port St Johns, Lady Frere, Highflats |
 |
 |
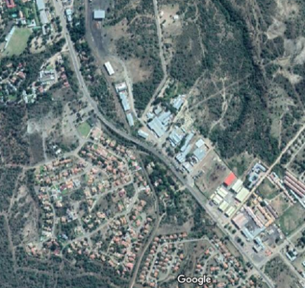
| Small Towns | Population: Less than 20 000 people in town itself Morphology: Monocentric small towns, often apartheid landscape double centre towns in sparse western parts of SA Economy and service role: Primarily serve local population and/or 'niche' economic activity such as mining, tourism or fisheries. Examples: Burgersfort, Coffee Bay, Nqamakwe, Lady Grey |
 |
 |
| Rural Settlement Areas & Villages | This area incorporates both (i) Formal Rural settlement area - EA's and Settlements Footprints classified as formal as well as (ii) Traditional Authority Rural Settlement Area - EA's and Settlement Footprint areas classified as traditional. Both have very small formal service economy activities. Within such areas Rural Service Settlements and smaller nodal settlements with limited population and economy but forming part of the South African group of towns can be identified for location of social services as applicable based on the population threshold and characteristics. These places will be separately identified in the next update of the typology. | 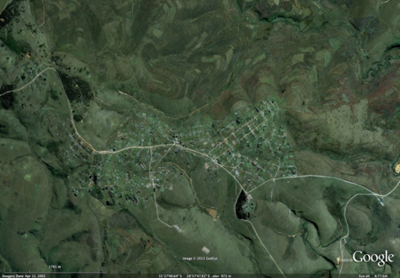 |
 |
| Sparsely Populated Rural Areas | Sparsely populated areas (meso zone areas without rural settlements) Sparse East (more than 10 persons per sq km) while in the Sparse West this is defined as less than 10 persons per sq km and has an impact on the accessible travel access distance and threshold of certain social services. | 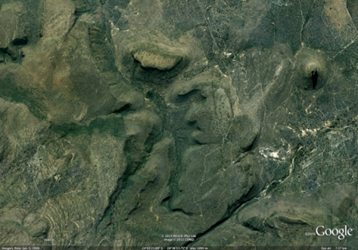 |
 |