


Spatially and temporally aligned socio-economic data is of critical importance in supporting a range of planning activities from preparing Spatial Development Frameworks (SDFs) at a local, regional, provincial and national level to the spatial prioritisation of specific infrastructure projects. To address this need for spatial and/or temporal aligned data CSIR developed meso-zones. The mesozones being a functional demarcation to which a range of key socio-economic data sets get aligned on an intermediate level (meso-level) for spatial analysis.
The Mesozone set is a demarcation of South Africa into a complete grid of 25 ,000 spatial units. These mesozones are not uniform in shape but aims to be approximately the same size (~50km2) – see example below.
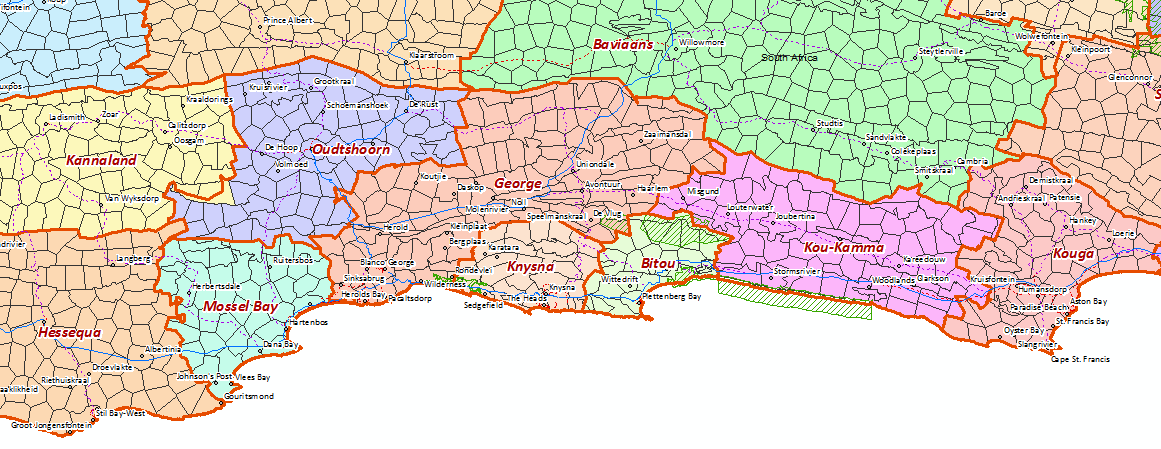
These mesozones were created in such a way that they fit completely within the current municipalities and other significant geo-economic and historic area demarcations. The zone boundaries correspond with major travel barriers (such as rivers) as well as ‘break lines’ between sparsely populated areas (such as mountains) and areas with medium to high levels of human activity (such as fertile valleys or built up areas).
The mesozones aim to address several problems typically found when working with spatially portrayed socio-economic data. These include the following:
- It is generally difficult to relate or compare spatial data that use differing analysis units and scales such as catchment data compared to information presented for local municipalities.
- To address the modifiable area unit problem (MAUP) which refers to arbitrary zone-size distortions of quantity maps. The MAUP is “a problem arising from the imposition of artificial units of spatial reporting on continuous geographical phenomena resulting in the generation of artificial spatial patterns” (Heywood, 1988).
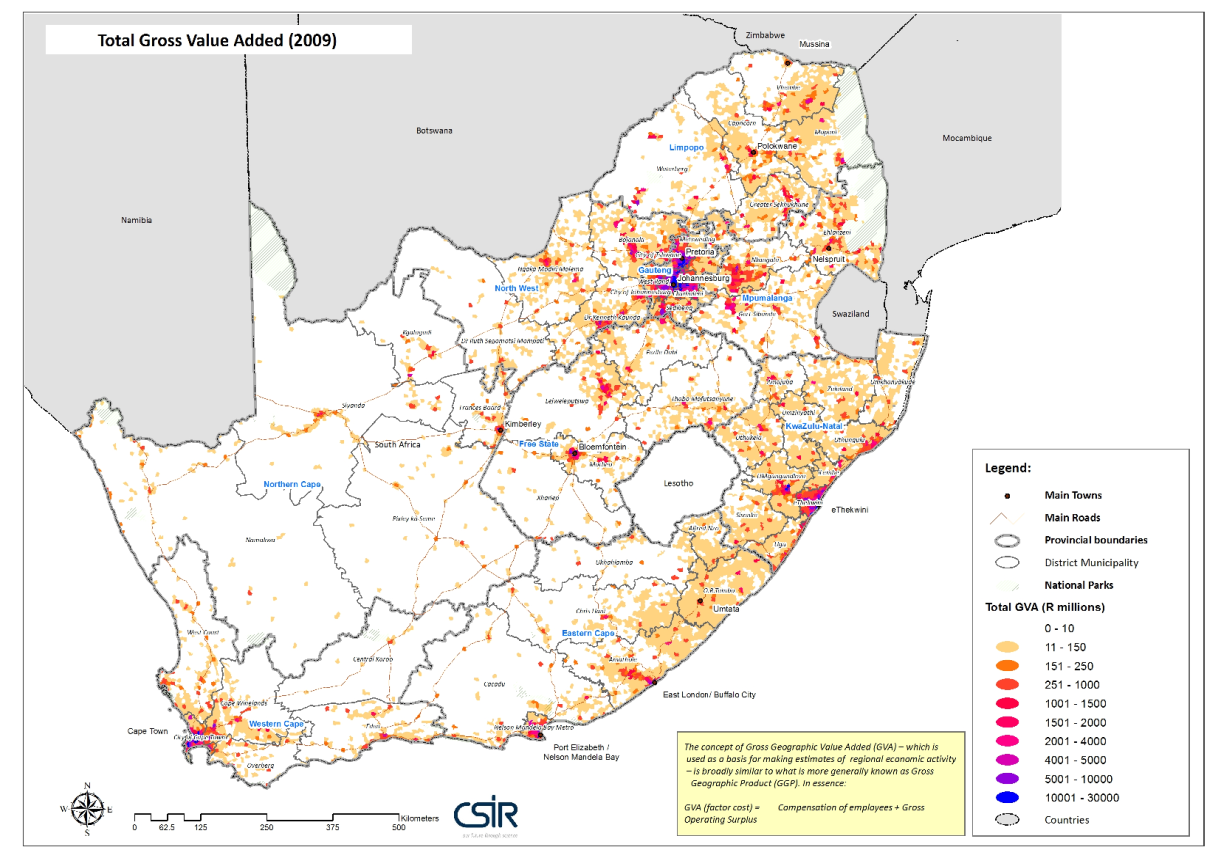
The fine granularity of information of the mesozones means that more spatially specific maps can be created that allow for a better understanding of the location and extent of features or activity. The following map serves as an example – indicating the spatial distribution of economic activity in South Africa.
Another advantage of having the data spatially aligned in almost equally sized zones (or spatial units) is that it allows more accurate accessibility and interaction modelling between units when doing this type of analysis at a regional or national level. For example, modelling of the level of access of agricultural production areas to key agricultural markets nationally. In undertaking this type of modelling the mesozones can be linked to a national level road network. The almost equally sized zones and the way in which they are demarcated also allows for minimal variation in access distances within each zone which leads to more accurate outputs for planning and decision making.
The various datasets are assigned to mesozones based on an algorithm developed by the CSIR and which is based on the principles of dasymetric mapping. A dasymetric map is the result of a procedure applied to a spatial dataset for which the underlying statistical surface is unknown, but for which the aggregate data already exists. The aggregate dataset’s demarcation is however not based on variation in the underlying statistical surface but rather the result of convenience of enumeration (Eicher & Brewer 2001; Mennis & Hultgren 2005). The production of a dasymetric map involves transforming data from the arbitrary zones of the aggregate dataset to recover (or try to recover) and depict the underlying statistical surface. This transformation process incorporates the use of an ancillary dataset that is separate from, but related to, the variation in the statistical surface (Eicher & Brewer 2001). Dasymetric mapping therefore has a close relationship with areal interpolation – the transformation of data from a set of source zones to a set of target zones with different geometry (Bloom et al. 1996; Fisher & Langford 1995; Goodchild & Lam 1980). Areal interpolation is mostly an areal weighting procedure and does not take ancillary sources into consideration when the spatial distribution of data is refined. Many areal interpolation methods can be incorporated into dasymetric mapping methods to improve the detail of a choropleth map below the level of the enumeration unit (Fisher & Langford 1995, Hay et al. 2005). As can be deduced from the principles of dasymetric mapping as a method of areal interpolation, the accuracy of the depiction of the data is heavily dependent on the quality of the ancillary data used to predict the variation in the spatial distribution of the variable in question. Another consideration is also that the ancillary data used must be updated regularly (at least yearly) to ensure consistency for future updates (Mans 2011).
The geospatial data layers provided on mesozone level are:
- the base mesozone dataset updated in 2016 and also containing the SACN/CSIR typology
- total population
- economic production indicator per sector (expressed as Rand values)
MESOZONE BOUDARY BASE
This shows the extent of the mesozones along with the latest district municipal and provincial boundaries. This version represents the updated 2016 version of the mesozones and incorporates the latest boundary revisions published by the Municipal Demarcation Board of South Africa.
TOTAL POPULATION DISTRIBUTION
An approach based on dasymetric mapping principles is used to calculate population distribution. The 1996 (EAs), 2001 (SPs), 2011 (SPs) and 2016 (SPs) population figures are the input data for the respective years which are then re-aligned to the mesozones to create a comparable time series data set. The Spot Building Count (SBC), ESKOM being the data custodian, is used as the secondary dataset to predict the underlying statistical service of the origin data. The SBC is a geo-referenced building frame developed using Spot 5 satellite imagery. The inventory concerned contains all classifiable building structures within the borders of South Africa. According to this classification, each point inherits a weight representing the potential contribution (household size) of the point in question.
The following factors are considered in undertaking the classification:
- residential areas which have not changed since the last census
- new urban growth areas
- informal areas
- commercial and industrial areas
- rural areas (agricultural, nature reserves and other sparsely populated areas).
COMBINED MAIN ECONOMIC SECTORS (presented as an index)
The concept of Gross Geographic Value Added (GVA) is used as a basis for making estimates of regional economic activity. GVA is broadly similar to what is more generally known as Gross Geographic Product (GGP), in essence:
GVA (factor cost) = Compensation of employees + Gross Operating Surplus.
The GVA data for the different economic sectors are produced on local municipal level by Quantec. The municipal level data is then assigned to the mesozones using the principles of dasymetric mapping where secondary data representing the potential points where production is occurring are used to re-assign the economic production data to the mesozones.
The result is an indicator of economic production per sector (excluding construction) expressed in Rands per mesozone. Owing to the transformation in the data through the dasymetric process, this cannot be seen as representing GVA values anymore. It is however a good indicator of how much has actually been produced by a specific sector within a particular mesozone. It is therefore an indicator consisting of ratio data which can be used to not only compare a mesozone with other mesozones across space (spatial comparison), but to also compare a mesozone with itself over time (temporally).
TOTAL EMPLOYMENT (presented as an index)
The total employment index per mesozone is derived from the GVA index discussed above.
The way in which this was calculated was by firstly calculating the ratio of the of GVA production per sector to the employment figure per sector for each local municipality. The employment and GVA data for the different economic sectors are produced on a local municipal level by Quantec. This factor is then multiplied with the economic production values per mesozone as discussed earlier.
The result is an indicator of employment per sector (excluding construction) expressed as the number of potential job opportunities at the place of where people will work. This is different to e.g. employment figures from the census which measures the number of employed people at the place of residence, and not where they are actually working.
The result is an indicator consisting of ratio data which can be used to not only compare a mesozone with other mesozones across space (spatial comparison), but to also compare a mesozone with itself over time (temporally).
The dataset is defined as the "SA CSIR MesoZone 2018v1 Dataset" and should always be referenced accordingly.
Download this data item using the following links (note the file is provided in a zip-file):
| SA CSIR MesoZone 2018v2 |
|
| SA CSIR MesoZone 2018v2 Metadata |
|
| SA CSIR MesoZone 2018v2 JSON |
|
Web Map and Feature Services allow you to display maps on your computer without the need to download the data. Depending on which option you choose you will receive an image (WMS) or vector (WFS) version of the dataset. You can use these web services with free software such as Google Earth and ArcGIS Explorer, and with many different GIS software packages.
| Theme | Contact | Telephone | |
| Project manager | Gerbrand Mans | (021) 888 2643 | gmans@csir.co.za |
| GAP application development | Johan Maritz | (012) 841 2928 | jmaritz@csir.co.za |
| GIS enquiries | Alize le Roux | (012) 841 3242 | aleroux1@csir.co.za |
- Bloom LM, Pedler PJ & Wragg GE (1996) Implementation of enhanced areal interpolation using MapInfo. Computers and Geosciences 22:459-466.
- Eicher CL & Brewer CA (2001) Dasymetric mapping and areal interpolation: Implementation and evaluation. Cartography and Geographic Information Science 28:125-138.
- Fisher PF & Langford M (1995) Modelling errors in areal interpolation between zonal systems by Monte Carlo simulation. Environment and Planning A 27:211-224.
- Goodchild MF & Lam NS (1980) Areal interpolation: A variant of the traditional spatial problem. Geoprocessing 1:297-312.
- Hay SI, Noor AM, Nelson A & Tatem AJ (2005) The accuracy of human population maps for public health application. Tropical Medicine and International Health 10:1073-1086.
- Heywood, D. Ian, S. Cornelius, and S. Carver. 1998. An introduction to geographical information systems. New York: Addison Wesley Longman.
- Mans GG (2011) Developing a geo-data frame using dasymetric mapping principles to facilitate data integration. AfriGEO Conference: Developing Geomatics for Africa, May - June 2011, Cape Town.
- Mennis J & Hultgren T (2005) Dasymetric mapping for disaggregating coarse resolution population data. In: Proceedings of the International Cartographic Conference, July 9-15, A Coruna, Spain.
- Naudé, A., Badenhorst, W., Zietsman, L., Van Huyssteen, E., and Maritz, J. (2007). Geospatial Analysis Platform – Version 2: Technical overview of the mesoframe methodology and South African Geospatial Analysis Platform. CSIR Report number: CSIR/BE/PSS/IR/2007/0104/B.
Core Team:
Gerbrand Mans, Johan Maritz, Dave McKelly, Alize le Roux, Mawande Ngidi, Elsona van Huyssteen, Cheri Green