

Explanation of the residential structure growth trends and spatial distribution of the growth – with reference to GTI & links to analyses
The recent Municipal Capability and Partnership Programme (MCPP) identified the need to provide additional information that could support municipal planning (IDP, SDF etc.) Due to the datedness of some government data – for example census data at the time of the MCPP work was more than nine years old, while the forthcoming census meant that new data would also remain unavailable at least until 2023. Municipalities however are currently in need of relevant information to support their legislated required planning processes (IDPs and SDFs). National Treasury and other national departments like DPME has a requirement that socio-economic data being quoted in these reports, plans and frameworks must be approved by StatsSAs’ South African Statistical Quality Assessment Framework (SASQAF) and as such StatsSA data itself becomes the main source due to their adherence to these requirements.The approach within the MCPP was to source the latest StatsSA data, but also to explore other data that could be used to further support planning. One key issue affecting municipalities is settlements – their location, population size, and if they are growing or declining as this could require larger infrastructure investment or ensuring efficient planning control is implemented. To quantify and extract growth trends, it was decided to explore satellite derived data as this was often a data item sourced on an ongoing basis with results produced at a higher frequency, thus more up to date.
GeoTerraImage’s
Another method to show the areas of growth was to create interpolated surfaces of the BBLU data reflecting change in settlements over time. The method utilised was Kernel Density – it calculates the density of features in a region around those features. The process creates a raster surface where the calculated values is written to each raster cell. The values in the surface is highest at the location of points and it decreases with increasing distance from points. The calculated density is then multiplied by the number of points or the sum of the population field if one was provided.
The GTI data reflected building-based land use point for the years 2000, 2010, 2015 and 2020. Residential building types were extracted from this dataset and applied in further processing as the main interest was to determine growth in residential areas. The differences between data years reflected the change that occurred and extracted differences between periods were the data used in the subsequent kernel density process. The kernel density results therefore only reflect the change for a particular period. The resulting surfaces were thematically processed and drawn into maps for the MPCC project.
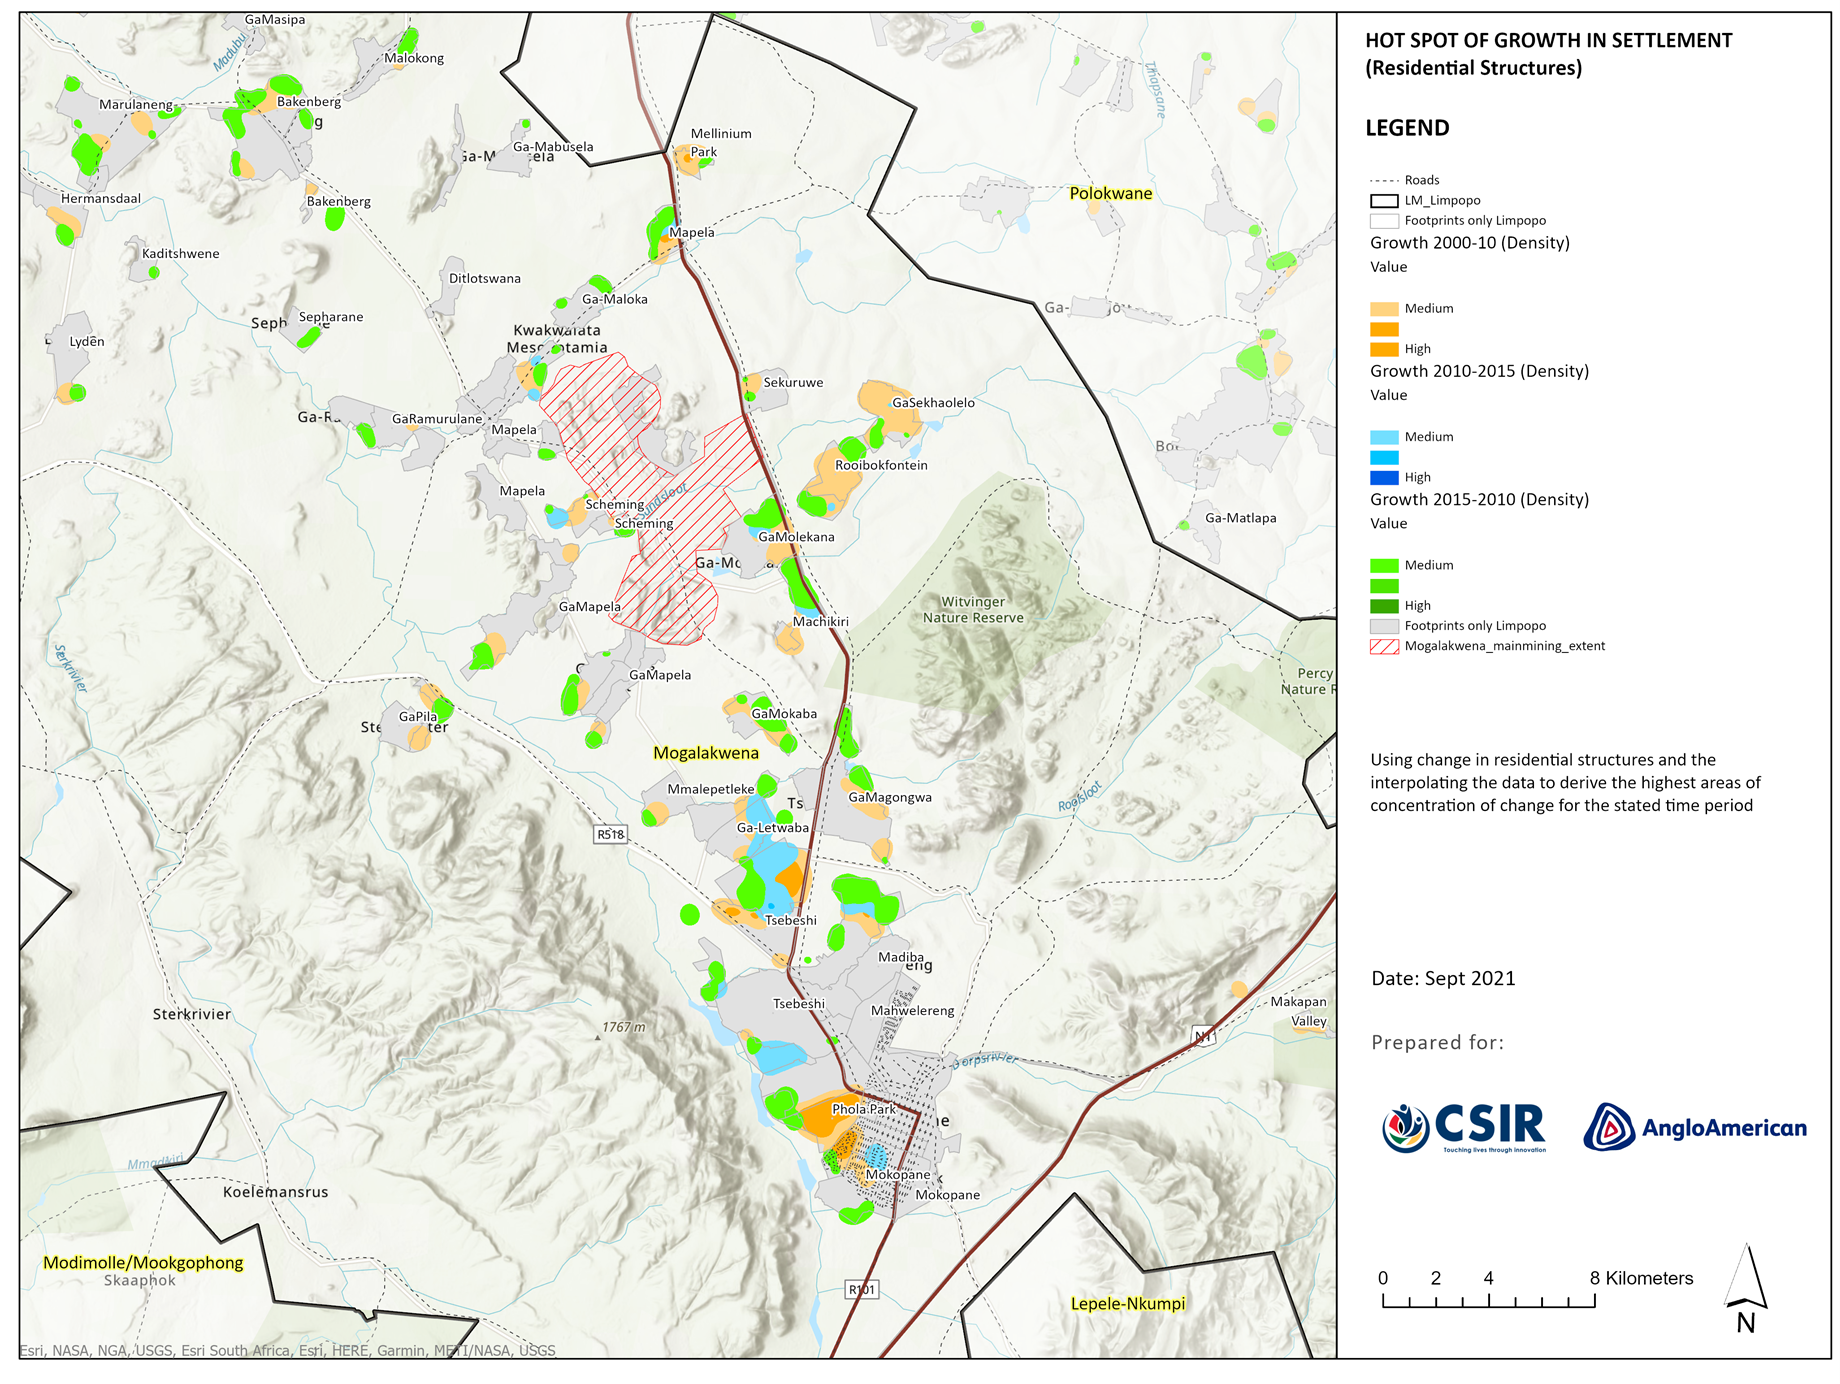
Kernel density map for apportion of the Mogalakwena municipality (MCPP project)
A limitation with the GTI information is that it does not reflect negative change over the period 2000 – 2015. This is due to the process used to capture and process building structures for earlier periods. In earlier periods the satellite imagery used was lower resolution and does not have the clarity and detail of the latest available imagery. Thus, the data is best suited to reflect growth areas.
Relating information to the settlement footprint dataset
The new settlement footprint layer was compared to the latest building-based land use points, and it was observed that building structure growth has already occurred beyond some settlement footprints. These settlement footprints were edited (enlarged) to ensure it included the new growth in residential areas. This would also make it easier to quantify growth numbers at a later stage. The point-based data was spatially joined to the edited settlement footprint layer. This was done for all data periods namely 2000, 2010, 2015 and 2020. Summarising the points for each polygon for each period resulted in the quantification of buildings per footprint represented in each period. Comparing the data between different periods enabled the quantification of growth in structures per settlement footprint unit. The data and the results of calculations were all linked to the spatial settlement footprint dataset, which meant that it could also be used to create thematic maps depicting growth per settlement.It must be reiterated that the counting of residential structures does not automatically equate to the number of the population, although a good proxy. A different process was applied to derive population numbers per settlement footprint mesozone based on the residential structures.
The intention is not to use this information as an indication of the number of people per settlement, but to reflect settlement growth focussing particularly on residential structures. Commercial and industrial structures have also been extracted and a similar process applied to determine where (their) growth has taken place. The following map illustrate the total number of residential structures related to the settlement footprint layer.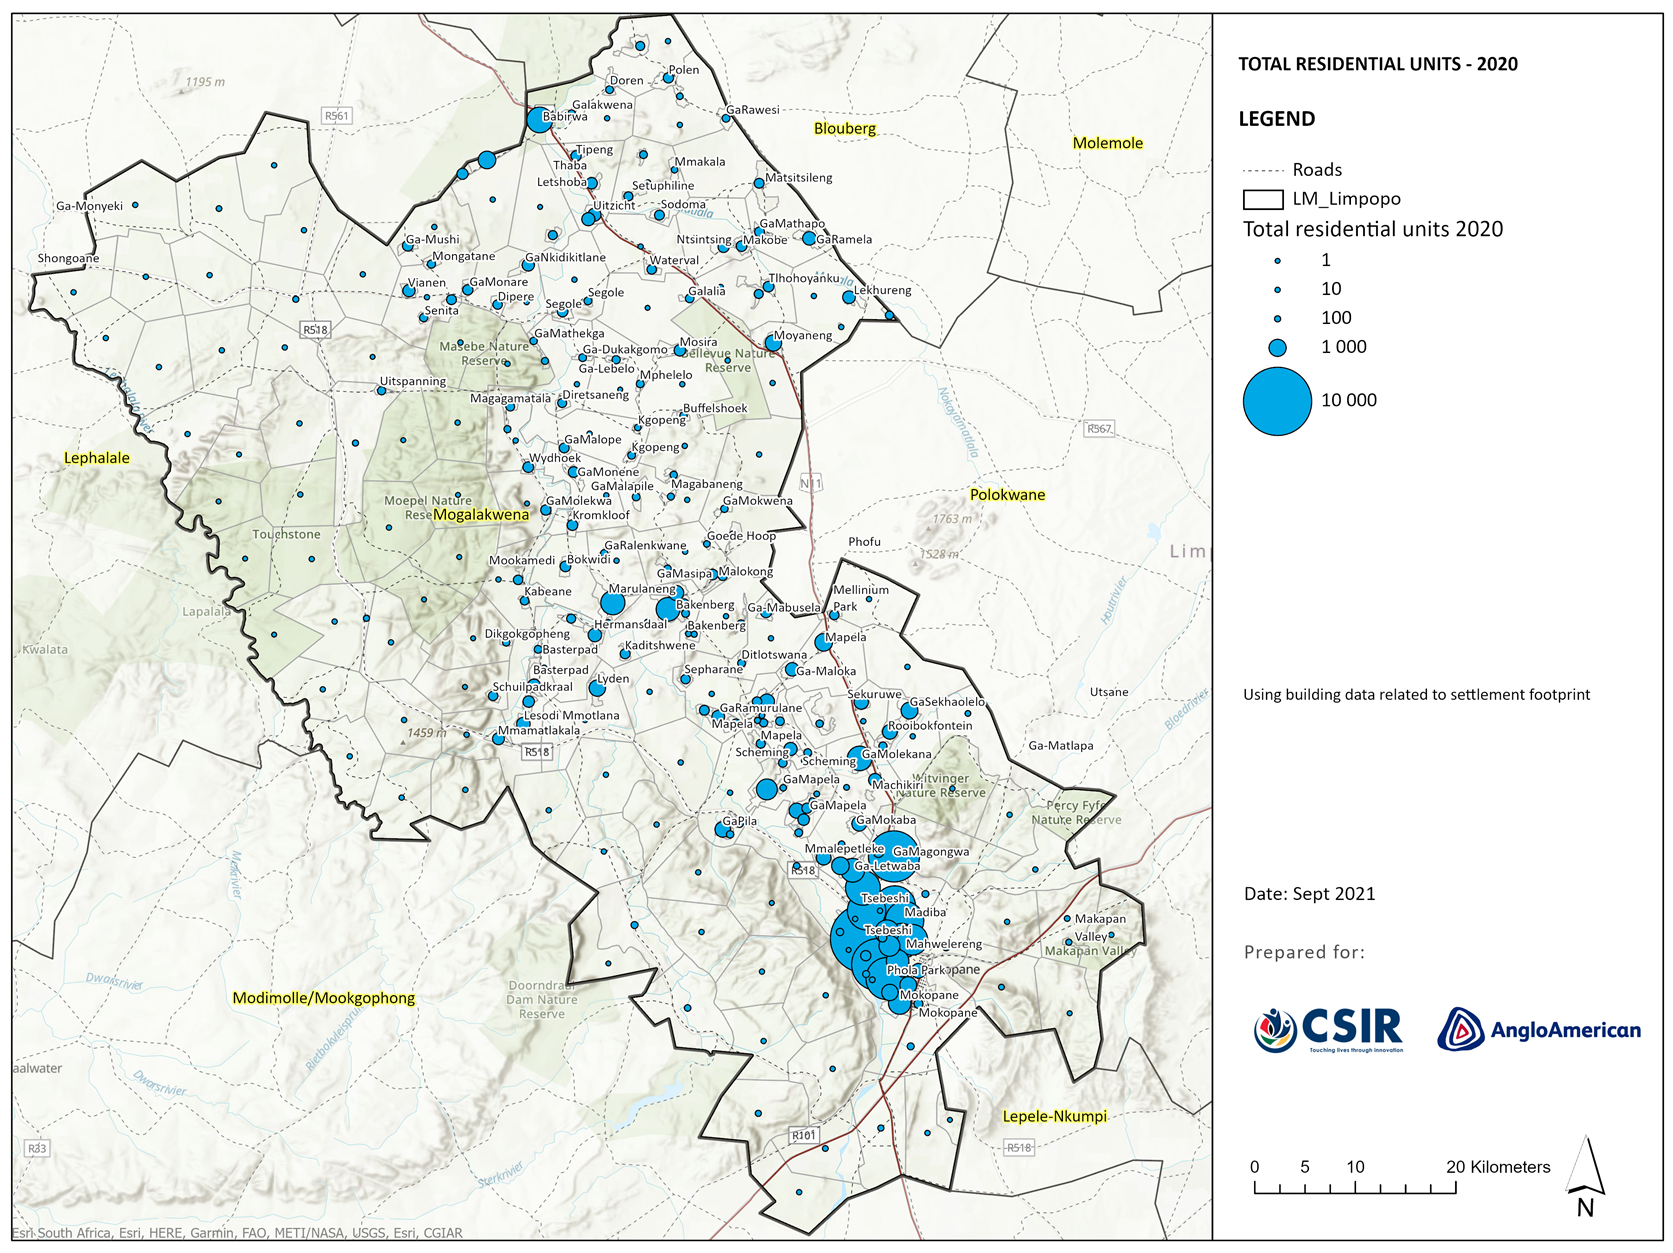
Population data reflected at the Settlement footprint mezosone layer
[1] GEOTERRAIMAGE specializes in providing up-to-date satellite derived information and decision support to a wide variety of public and commercial sectors