To apply its customised methodology, the CSIR mainly uses Flowmap – a freeware system developed by Utrecht University in the Netherlands – for the catchment area analysis and proprietary GIS based software for mapping. One of the main features of Flowmap is its software algorithms for simultaneously analysing and matching the supply and demand of services of several facilities of the same type over a wide area while taking both service capacity and travel access parameters into account. The demarcation of individual facility catchment areas is based on actual travel distances or times along a network of roads or pedestrian pathways. This means that the “severance effect” of rivers, railway lines, and so forth can be explicitly modelled.
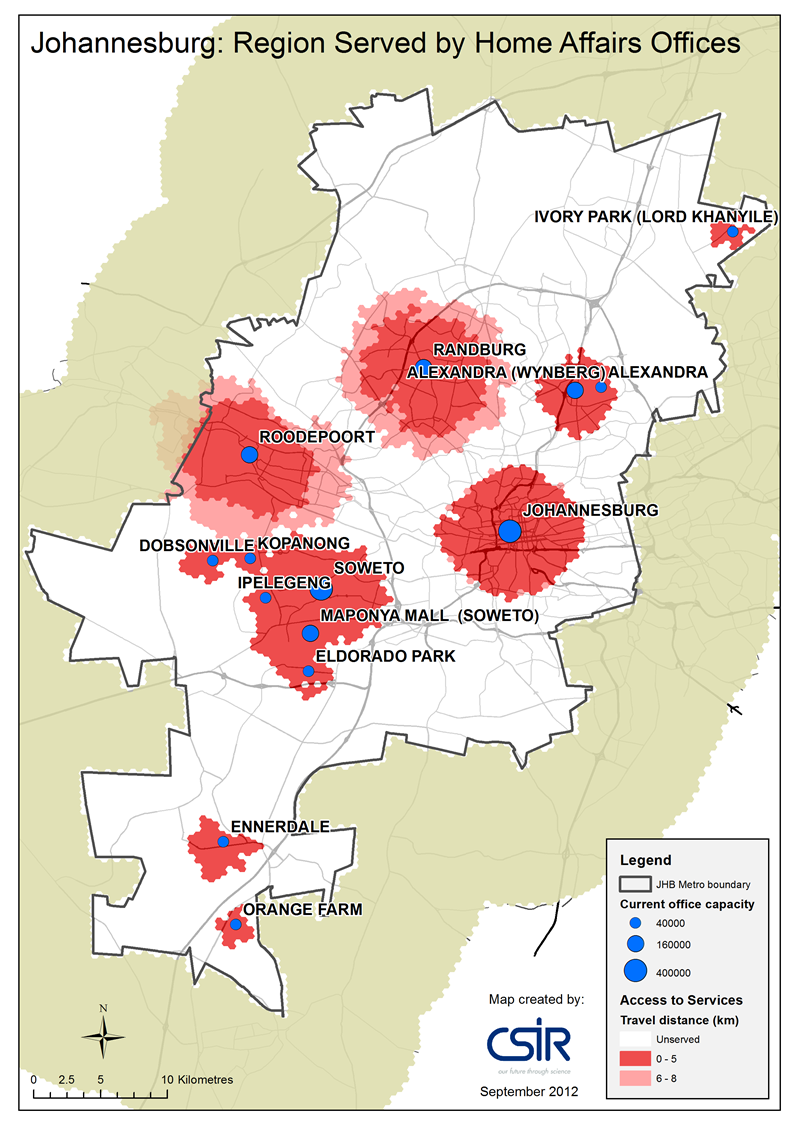
When applying the software, the study area is usually divided into equally sized hexagons, which are then linked to the nearest point on the network. The hexagons used for disaggregation of both demand (population) and supply and are also used for the mapping of results – such as travel time to the nearest facility. This greatly improves the ease of interpreting the results, as well as increasing the accuracy of service access indicators (e.g. indicators of the proportion of population with sufficient access to specified facilities) and of locating new facilities or points of expansion to serve any backlog. Click to read more.
CSIR has pioneered the development of a customised methodology for service access planning in South Africa. This includes validated procedures for undertaking the following:
It must also be noted that effective delivery of services requires more than a good location and will always depend on to the quality of facility design and capacity, number of staff and range of facilities provided. Operational issues including competency of staff and facility maintenance are also essential. By having good standards and the necessary data it is possible to do a fairly good analysis of the equitable distribution of facilities. One can determine where backlogs are, determine spatial mismatch between supply and demand as well as determine the optimal location for new facilities. This analysis does not, however, take the needs of the community into consideration. We rather propose a process by which the power of accessibility analysis in GIS is coupled with a community consultative process to ensure better decision making by local authorities and thus the development of better policies. This will again lead to better and more sustainable development. There are pros and cons to each of these processes but together they complement each other to arrive at the best possible solution within a developing-country perspective where limited funding and massive backlogs are a reality.
For more information contact:
Pryaska Naidoo, CSIR
pnaidoo8@csir.co.za
Gerbrand Mans, CSIR
gmans@csir.co.za